Part 1. Analog Front-End. Opto-Isolator.
Looking at the Power Quality Analyzer display, I was wandering, if there is any error in the measurement results, introduced by transformer. Overall THD picture doesn’t change much, suspiciously drawing same chart in the morning and in the evening, when electrical grid load significantly differs. Obviously, to estimate effect of the transformer, I have to repeat measurements w /o one, than check again if there is something new. It is one reason, why I decided to design my own Analog Opto-isolator.
Thinking of Power Meter project, I realized, that except Voltage Isolator, I’d need Current Isolator as well. Things are easier with Voltage measurements, even I’m not sure at this time if transformer relayed harmonics content proportionally / correctly to what is has at the input, the same time dynamic range for Voltage is quite narrow. Value is not changing much from default 110V, may be -10 ~ +10 % at the most. But it’s not the case for Current, which may vary over great extent.
Quick search over the i-net for AC current sensors, brings quite disappointing results. Sensors based on Hall Effect IC with optical isolation are expensive. Another category – Current Transformers, using simplest and well developed for over 200 years technology is also not cheap. And not accurate. Data sheet specification, what I read, states that liner response of typical current transformer is only in a range 1 – 100 %, or just 40 dB. Price tag – several dollars and up. Even more expensive, and definitely not for hobbyist budget, most advanced samples have 0.1 – 100 % range, or 60 dB. And it’s another reason, to develop Analog Optoisolator, which would cost less, and be linear over 90 dB.
Warning: Shock Hazard
The meter described in this project connects to high currents and high voltages. High currents and high voltages may be hazardous, even lethal. I’m not taking any responsibility for consequence that may result from the use of this publication or the circuitry described herein.
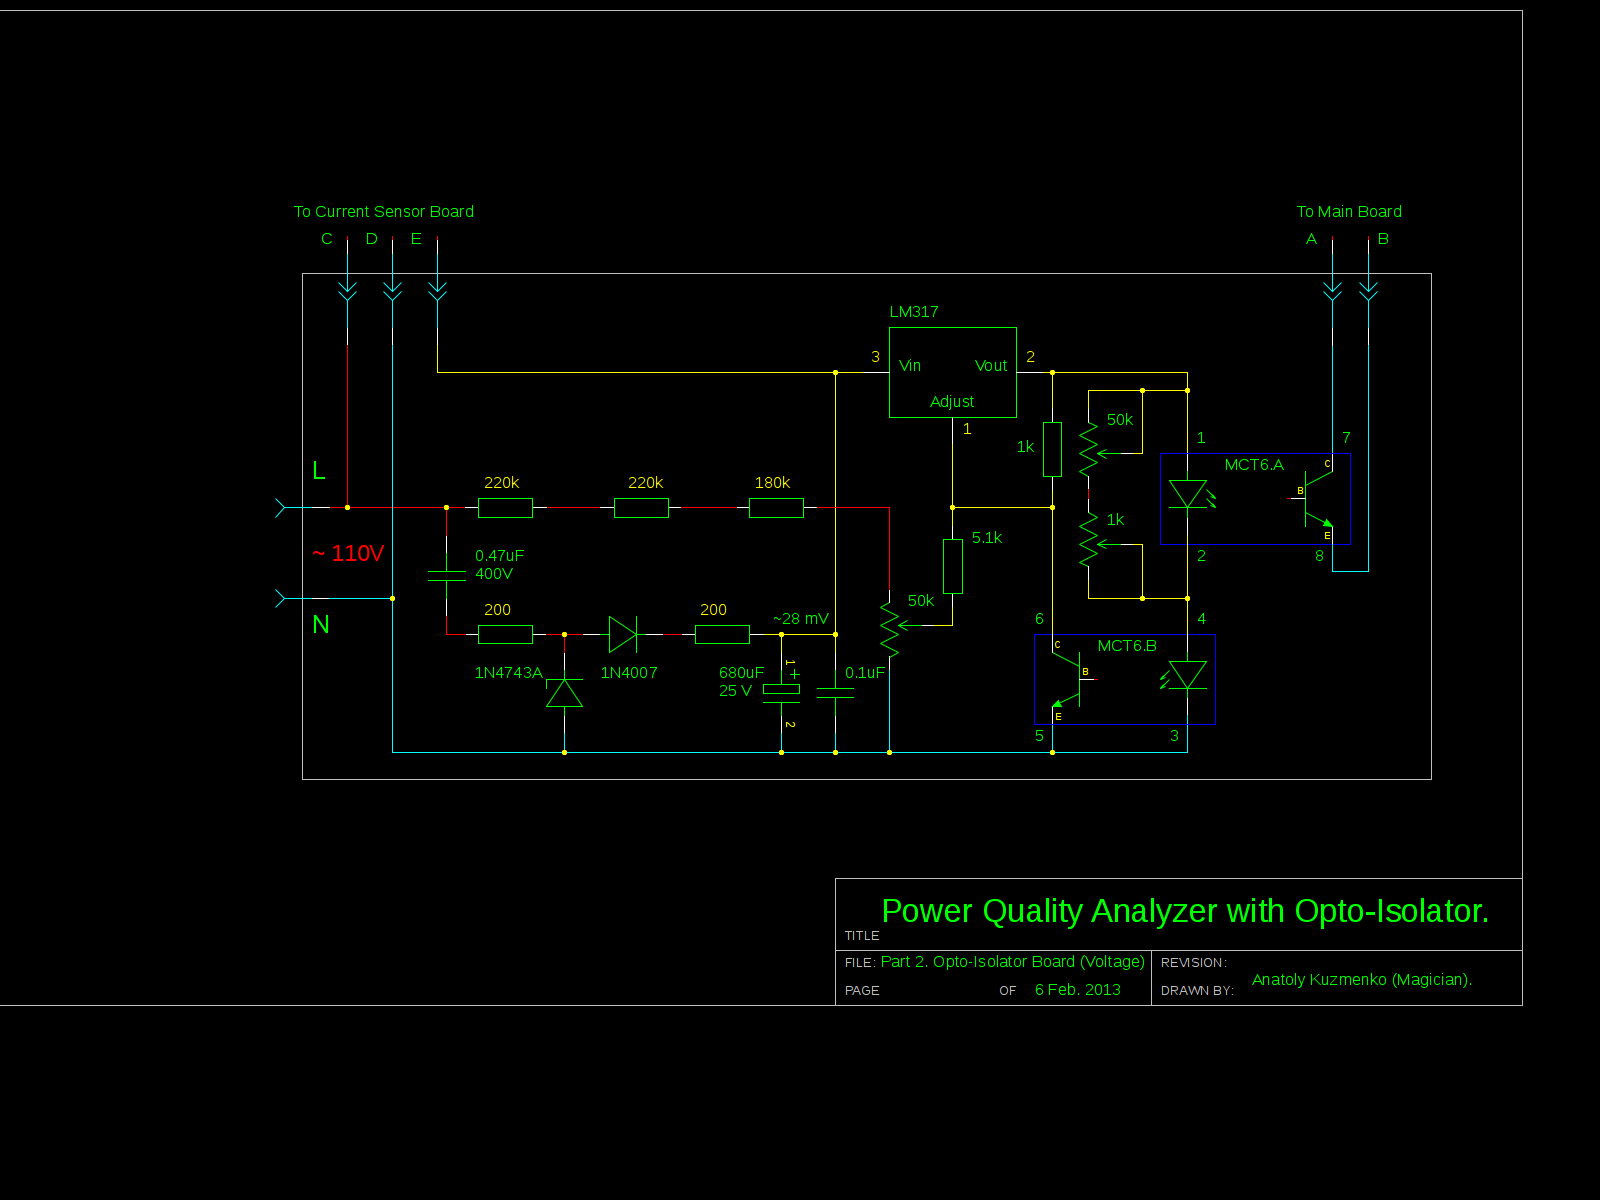
Don’t turn away, circuit shown above, despite it’s simplicity has outstanding performance:
- Linearity better than 0.1%
- Dynamic range more than
100 dB50 dB. - Voltage gain ~25.
As you can guess, the reason not to use OPA and Linear opto-coupler in design, is to bring down overall cost. There is no need for amplifier at the other end, photo-transistor loaded by 4.7 k resistor. Voltage gain is not required for voltage sensing board, but it’s must to be in current sensing circuit, as shunt resistor outputs low voltage level, which in next turn limited by dissipated power. For example, assuming 0.25 W for power losses on shunt resistor, voltage would be: V = P / I, and for 20 A load generates only 12.5 mV. Having gain 25, 0.883 V peak-to-peak obtained at the output, which is perfectly match with arduino 1V ADC reference level. There is only one drawback. Circuit, based on Voltage regulator IC ( LM317 – configured as operational transconductance amplifier – OTA), requires manual adjustment / balancing for THD level. Good news, you have to do it only ones.
DC level matching to switch On internal 1V reference is not finished, work in progress. Would require 2 resistors and two caps in minimum configuration, may be voltage regulator / reference for filtering.
Same with ripple voltage (shown ~28 mVp-p on first drawings), probably, will add up LM7809 later on.
Two photo-transistors of the optocouplers loaded asymmetrically, 1k and 4.7k, in order to have maximum voltage gain. Plus, they have different collector voltage, so current passing via one LED has to be reduced. The easiest way to make initial adjustment, is to power up circuit from 12V insulated power source ( any cheap wall-wart / wall-mart is o’k), than apply sine waveform at the upper side of trim (50 k – adjustment pin LM317) pot. Next, measure THD level at the output using any available spectrum analyzer. I used my computer sound card and JAAA software. In this test, output may be powered from the same power source (better not, especially with wall-wart / wall-mart) or using arduino +5V.
First things to do, is get approximately 2.5V DC ( for +5V power source ) level at the output, tweaking another 50 k pot, which is in parallel to optocouplers photo-diode. Than do a fine tunning using 1k. Objective is to minimize THD level. 3-rd and 2-nd harmonics are most noticeable, but there is a chance, that “optimum” settings for them would be slightly different. If so, reduce input, and see that you have K-3 lower than -60dB, than make adjustment till K-2 drops to same or close level. Repeat a few times. Basically, technics is similar to balancing audio PA.
Source : Power (Energy) Meter using Arduino