Summary of New Arduino Project: Spectrum Analyzer?
This article describes a DIY project to build a basic spectrum analyzer using an Arduino and a Direct Digital Synthesizer (DDS) module. The device scans the 0.5 MHz to 40 MHz range to measure signal attenuation through filters, helping ham radio operators identify front-end overload sources without expensive equipment.
Parts used in the DIY Spectrum Analyzer:
- Arduino
- Direct Digital Synthesizer (DDS) module
- RF voltmeter (input)
- Probe
- Filter
- RF voltmeter (output)
I’ve been reading a lot about receivers, and it sounds like one important thing is filtering. It makes sense too – simple receivers can suffer from front end overload due to a strong signal. And when on the ham bands, you never know where that strong signal may be – it could be someone driving down the road (which is a bit obvious once you see it), but in my neighborhood, if you don’t know me, you’re probably not going to know about the antennas in my attic.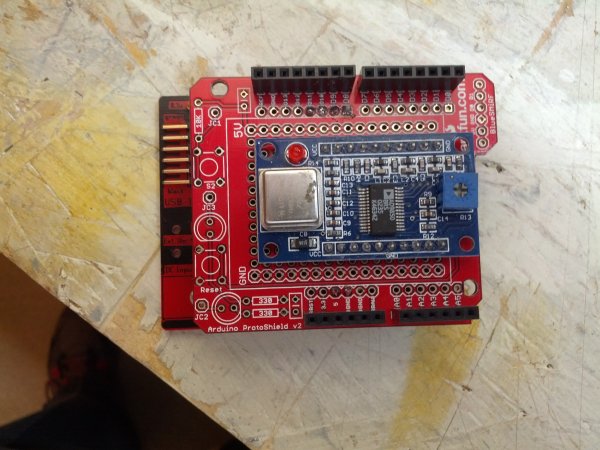 I don’t have a spectrum analyzer, and since I’m a traffic engineer, I really don’t have access to one. I don’t need a full-blown spectrum analyzer, either, I just need to sweep through the HF band and get the difference between signal input and output. Math will take care of the rest.
dB=20*\log{\frac{V_{out}}{V_{in}}
The way I figure it is this:
An Arduino (and this could become a Raspberry Pi or any number of other devices, but I’m going to use an Arduino because it’s cheap and relatively durable) controls a direct digital synthesizer (DDS) module that just scans through it’s limits… well, probably something like 0.5 MHz – 40 MHz – that gets me into the AM broadcast band (which can be a source of strong signals) to above the 10m band (I don’t know what’s up there, but whatever’s there is probably not running 50,000 watts).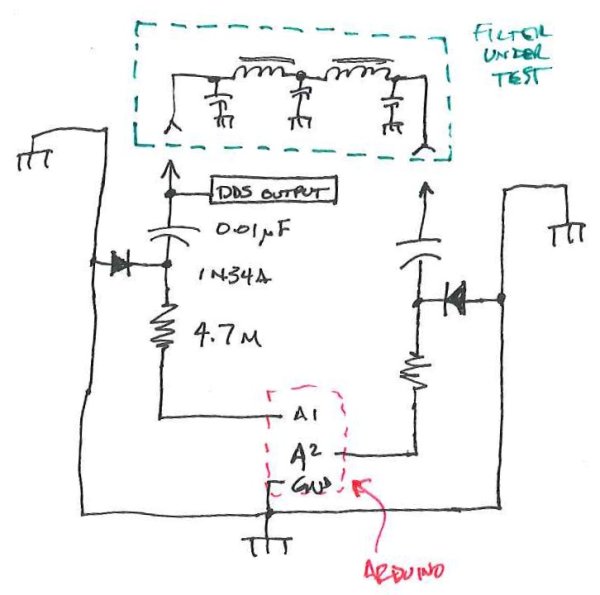 The output of the DDS would have an RF voltmeter and a probe to go to a filter. There would be another RF voltmeter to sense a filter output. The Arduino would handle not only control, of the DDS, but also sensing the voltage.
It’ll look something like this:
This is a block diagram/schematic of how this will work. I didn’t include the DDS module, which would be tied in there somewhere.
The Arduino and DDS will look like this:
For more detail: New Arduino Project: Spectrum Analyzer?
- Why is filtering important for simple receivers?
Simple receivers can suffer from front end overload due to strong signals. - What frequency range does the DDS module scan?
The module scans from 0.5 MHz to 40 MHz. - Why was the Arduino chosen over other devices like a Raspberry Pi?
The Arduino was chosen because it is cheap and relatively durable. - How is the difference between signal input and output calculated?
Math is used with the formula dB equals 20 times log of V out divided by V in. - What components control the scanning process?
An Arduino controls a direct digital synthesizer module that scans through its limits. - What is the purpose of the RF voltmeters in this setup?
One RF voltmeter senses the filter input while another senses the filter output. - Can other devices be used instead of an Arduino for this project?
Yes, the text mentions this could become a Raspberry Pi or any number of other devices. - Why might someone need this tool instead of a full-blown spectrum analyzer?
Users may not have access to a full-blown spectrum analyzer but still need to sweep bands.