Summary of Data Logger Project using an Arduino
This article details a student-built Arduino data logger designed to record light and temperature. The system reads sensor data, displays values on an LCD with dynamic background colors based on readings, and saves the information as CSV files to an SD card for Excel analysis.
Parts used in the Data Logger Project:
- Datalogger shield
- Stackable header pins
- LCD Display
- Arduino Uno R3 (or Experimentation Kit)
- Photo cell
- Analog Temperature sensor
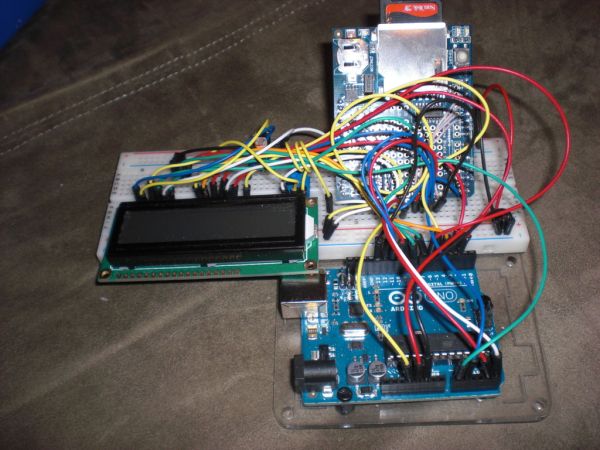
This is a data logger I made for my class. I couldn’t find any instructions that I could use to make the Arduino record the light brightness and the temperature. Then display the temperature and the light value on the LCD then Save it to the SD card
Requirements
Here are the requirements for the Datalogging shield project (project #1):
- Collect data from at least 2 sensors
- write the data at regular intervals to the SD card, collect it in a comma separated variable file (*.CSV) that can be imported into excel.
- display the data to your LCD screen
- have the background color of the screen change somehow. Either from the data being collected (green background for nominal values, red for warning), or through the use of a button.
Step 1: Parts
Here are what I used for parts. From my experience if your trying to follow instructions while learning and are using different parts it is much harder.
If you don’t want to buy the stackable header pins for the Datalogger shield you can use some way like how I modified the Datalogger shield in step 2 so that it could be placed in the bread board.
Datalogger shield
stackable header pins
LCD Display
Experimentation Kit for Arduino (Uno R3)
or
Arduino Uno
Photo cell
Analog Temperature sensor
Step 2: Modify the Data logger
If you have the stackable header pins on the data logger then skip this step. These are the pins that are needed for the SD card to work. you can solder wires to the board or follow my pictures.
3v, 5v, Gnd, A4, A5, 13, 12, 11, 10.
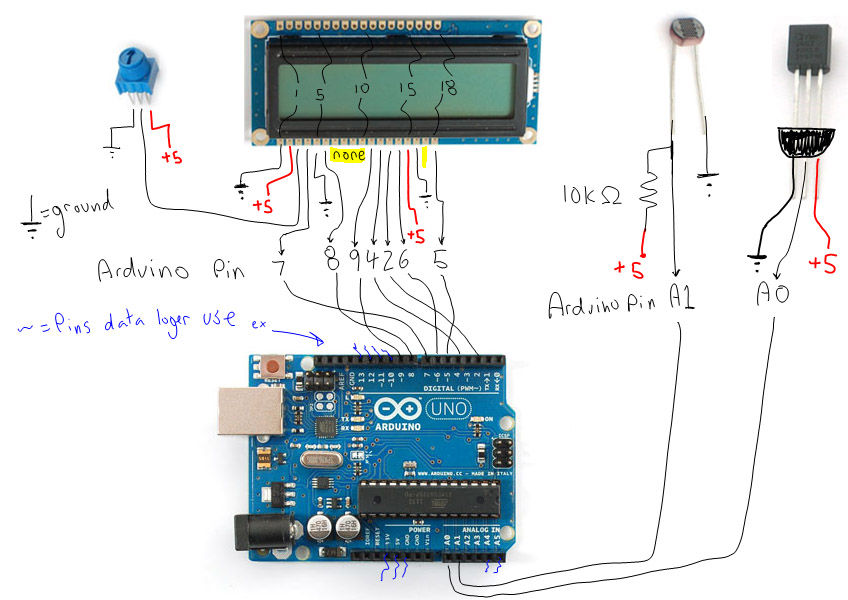
Step 3: Wiring Diagram
Here is the wiring diagram for my data logger. It is drawn as if you are using the stackable header pins. But the arduino pins that the data logger use are marked also.
Here is a table for where each lcd pin goes for my code to work.
the LCD pin corresponds to the Arduino pin below it. If it appears out of alignment copy it to notepad.
1, 2, 3, 4, 5, 6, 7, 8, 9, 10,11,12,13,14,15,16,17,18, lcd
g,+5,pt, 7, g, 8 , 9, 4, 2, 6,+5, G 5, arduino final change
Step 4: Libaries
LiquidCrystal – Already installed
SD – Already installed
Wire – Already installed
RTClib – HERE
- What sensors are used in this project?
The project uses a photo cell and an analog temperature sensor. - How is the collected data saved?
Data is written at regular intervals to the SD card in a comma-separated variable file format. - Can the data be imported into Excel?
Yes, the CSV file created can be imported into Excel. - Does the screen background change color?
Yes, the background changes based on the data being collected or through the use of a button. - Which library is not installed by default?
The RTClib library must be manually added to the Arduino folder. - What if I do not have stackable header pins?
You can modify the Datalogger shield by soldering wires to the board or using specific pin connections. - Which Arduino pins are needed for the SD card?
The required pins are 3v, 5v, Gnd, A4, A5, 13, 12, 11, and 10.