Summary of Audio VU meter with Extra wide Dynamic Range 69 dB using Arduino
This project builds a studio-grade, single-channel VU meter with 24 steps (3 dB each) spanning −63 dB to +6 dB, using Arduino ADC and RGB LED bar-graph. It uses a two-stage OPA (NE5532) input amplifier with switchable gain via the ADC multiplexer for autoscaling, preserving flat frequency response from 40 Hz to 20 kHz. Design balances ADC bit limits, amplifier headroom, and crest factor to extend usable dynamic range; calibration is stored in EEPROM. Display uses the RGB scheme from the Tears of Rainbow project arranged as one long bar.
Parts used in the Studio-grade VU meter:
- Arduino (with 10-bit ADC)
- NE5532 op amp (OPA)
- Resistors for stage 1: 10 kΩ and 1 kΩ
- Resistors for stage 2: 100 kΩ and 1 kΩ
- RGB LEDs arranged as a single linear bar-graph (from Tears of Rainbow)
- PCB or prototyping board and wiring
- EEPROM (internal Arduino EEPROM used for calibration)
- Power supply for Arduino and op amp
- Input coupling/bias components for DC biasing (capacitors and bias resistors)
- ADC multiplexer (internal Arduino ADC multiplexer used to select cascades)
O’K, after having some fun with stereo version of the VU meter I described in my previous blog-post, now it’s time to do a serious stuff. Studio grade VU meter !!! 24 steps, equally spaced every 3 dB, covering Extra wide Dynamic Range from -63 up to +6 dB. Single (mono) channel this time, no messing around, absolute precision at the stake. Plus, it keeps absolutely Top-Flat linear frequency response from 40 Hz up to 20 kHz(*).
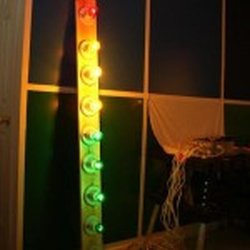
I’m not going into details of RGB LEDs Display, which has no modification since “Tears of Rainbow” project, only plates installed in one line, form a single GIGANTIC bar-graph. There are some minor changes in mixing colors data tables, but they intuitively understandable. The most important feature in this project is autoscaling. As you, probably know, Arduino has 10 bits ADC. Only it can’t process negative half-wave, and for this reason it has only 9 bits available for AC measurements. According to DSP theory, maximum dynamic range is:
DR = 1.77 + 6.02 x B = 1.77 + 6.02 x 9 = 55.95 dB.
As input audio waveform represents anything but perfect peak-to-peak 5V sine-wave, real dynamic range would be lower. How much? In first, there is a hardware limits. OPA (NE5532), which is:
- very low noise !!!
- high output-drive capability;
- high unity-gain and maximum-output-swing bandwidths;
- low distortion;
- high slew rate;
- input-protection diodes, and output short-circuit protection
but, unfortunately, isn’t rail-to-rail type. Test results show, that compression become noticeable (~1 dB) when not scaled magnitude approaches level about 50 dB. That is in good agreement with observed on oscilloscope not distorted deviation peak-to-peak 2.5 V. Or only half of full range of 5V. And as theory says, half is one bit less, and real DR = 1.77 + 6.02 x 8 = 49.93 (~50 dB). In second, audio data is processed on “block” structure basis. It means, having average of the block 50 dB, doesn’t mean that there was no spikes in the sampling pull, that obviously would be clipped and introduce error in the measurements results. This phenomenon is defined as Crest Factor. Different sources estimate crest factor of musical content between 10 – 20 dB. So, taking direct approach, Arduino with OPA mentioned above as front-end could accurately cover only: 50 – 20 = 30 dB. To get wider dynamic range, I have to scale input amplifier gain, and this is exactly what I did, building amplifier in two stages and selecting one cascade (by-passing second one) or two cascades using internal ADC multiplexer. As there is no switching IC in analog signal path involved, gain is defined with high stability, could be one time precisely measured – calibrated via coefficient stored in EEPROM (nice feature to add).
On the right side there are electrical drawings of “slightly” modified kit, where stereo amplifier was converted into 2 stage mono version. First stage, with gain about G1 = 1 + 10 k / 1 k = 11 is necessary to “bump-up” line-level signal, to create DC bias required for correct operation of the ADC, and also served as buffer to lower signal source impedance, as it seen by ADC input. I set a gain of the second stage amplifier at 40 dB: 20 x Log_10 ( G2 ), where G2 = 1 + 100 k / 1 k = 101.
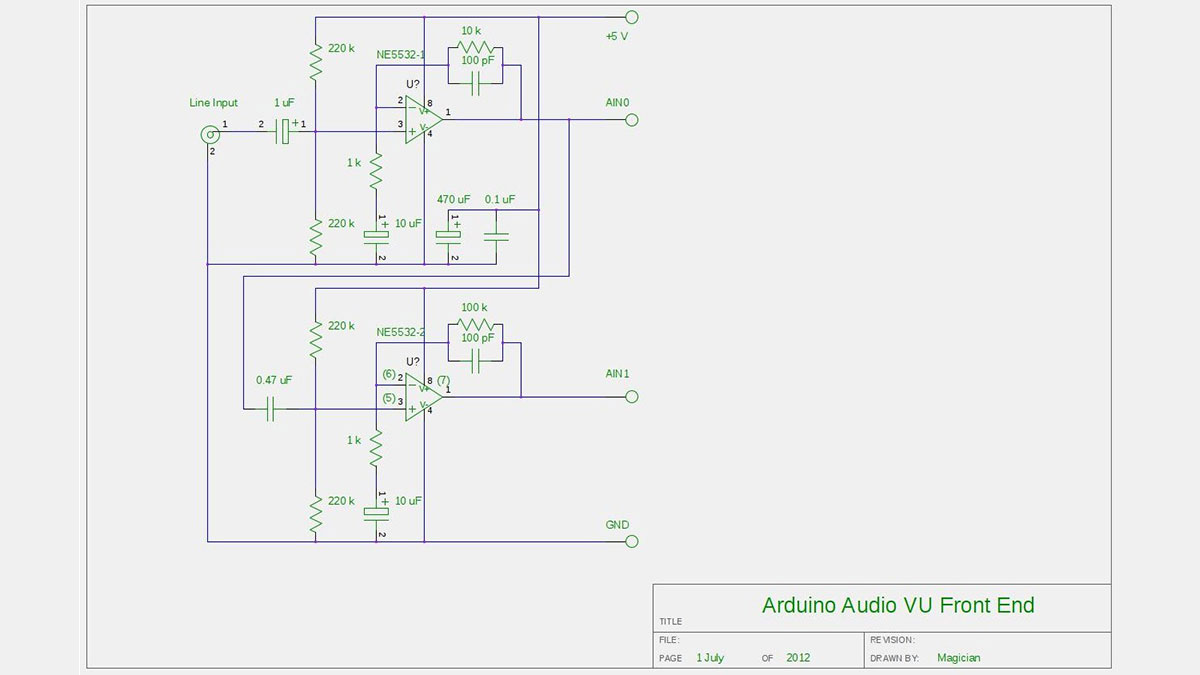
IMHO, setting gain limit for only 30 db per stage as it follows from paragraph above, is overkill, and would be justified for “real-time” radio broadcasting or audio processing for storage media, when high fidelity of audio program must be preserved. For visual display “clipping” of bursts in signal is not noticeable at all due high refresh rate of display, 78 Hz. Human just can’t see, if LED lights-up with such speed. For steady AC amplitude measurements (micro Voltmeter mode) this is not a problem at all, and headroom as small as 3 dB would be sufficient, leaving wide 47 dB per stage.
LED
For more detail: Audio VU meter with Extra wide Dynamic Range 69 dB using Arduino
- What dynamic range does the VU meter cover?
The meter covers an extra wide dynamic range from -63 dB up to +6 dB (69 dB span). - How many display steps and spacing does the meter use?
It uses 24 steps equally spaced every 3 dB. - Which op amp is used in the input amplifier?
The NE5532 op amp is used as the front-end amplifier. - Why is a two-stage amplifier used?
Two stages allow switchable gain to extend usable dynamic range and provide DC bias and buffering for the ADC. - How are the gain values set for each stage?
Stage 1 gain is G1 = 1 + 10k/1k = 11; stage 2 gain is G2 = 1 + 100k/1k = 101 (about 40 dB). - How does the project handle autoscaling?
Autoscaling is done by selecting one or two amplifier cascades via the Arduino ADC multiplexer and calibrating gain coefficients stored in EEPROM. - What limits the Arduino ADC dynamic range?
Arduino has effectively 9 bits for AC measurements (no negative half-wave), theoretical DR ~56 dB, reduced by amplifier swing limits and crest factor. - How does crest factor affect measurable dynamic range?
Crest factor (10–20 dB for music) reduces the usable dynamic range because spikes can be clipped during block-based processing; the author estimates a 20 dB reduction in practice. - Does the display electronics differ from the Tears of Rainbow project?
The RGB LED display follows the Tears of Rainbow design with plates installed in one line to form a single bar-graph; only minor color table changes were made. - What frequency response does the meter maintain?
It maintains a top-flat linear frequency response from 40 Hz up to 20 kHz.