Summary of Arduino – Solar MPPT Battery & Phone Charger
This article documents a beginner-friendly DIY MPPT solar charge controller project using Arduino, covering MPPT theory (Perturbation & Observation), design choices, schematic details, PCB fabrication, and firmware logic. It explains chosen components, circuit blocks (sensors, synchronous buck converter, MOSFET driving, backflow protection, LCD), design lessons, and practical warnings about wiring, decoupling, pull-downs, and PWM limits. The author emphasizes learning, trade-offs, and that the design serves as a reference rather than an optimized commercial solution.
Parts used in the MPPT Solar Charger Project:
- Soldering Station
- 3D Printer
- Arduino UNO
- INA219
- PCF8574
- IR2104
- MT3608
- TPS61175
- 2x 18650 LI-ION 1800mAh battery
- 16x2 LCD
- 2x BC547
- 2x IRF510
- IRF9540NPBF
- 4x MBRS340T3G
- ES3D
- 5mm Red LED
- 220uH inductor
- 4.7uH inductor
- 22uH inductor
- 2x 10k NTC
- 2x 1k POT
- Switch
- Various capacitors and resistors (including decoupling caps C2, C3, C16, C17, C7 bootstrap)
- Diodes (including D1, D4)
- Headers for Arduino connection
I always wanted to make a PCB and this is my first professional circuit board attempt. So before you decide to start this project you should know there could be some mistakes or it could be more reliable and compact. This design is not the most efficient and cheapest way to make a DIY MPPT design. There are many reasons for this matter. First of all, when I choose a component it has to be easy, cheap, and reachable. Also, I already had some components and wanted to use them. The second reason, I wanted my design to be as simple as possible. The main reason is these processes have to be educational and in the end, the product should be usable. Thus, the designing process was elaborated for these reasons.
My goal is to introduce you to the concept and some design tips. So, if you decide to make your circuit I suggest you shouldn’t copy this. You should take this circuit as a reference.
I am really keen on solar-powered circuits and I wanted to learn the MPPT concept for years. The best way to learn something is to make it, so I started designing my circuit.
If you have any questions about the circuit, feel free to contact me. If I have a solution, I will try to respond in my free time.
Before I start I really suggest you read the MPPT project of ASCAS. He has done a really great job.
Supplies
- Soldering Station
- 3D Printer
- 1x Arduino UNO
- 1x INA219
- 1x PCF8574
- 1x IR2104
- 1x MT3608
- 1x TPS61175
- 2x 18650 LI-ION 1800mAh battery
- 1x 16×2 LCD
- 2x BC547
- 2x IRF510
- 1x IRF9540NPBF
- 4x MBRS340T3G
- 1x ES3D
- 1x 5mm Red LED
- 1x 220uH inductor
- 1x 4.7uH inductor
- 1x 22uH inductor
- 2x 10k NTC
- 2x 1k POT
- 1x Switch
You can order the components on the schematic.
Step 1: INTRODUCTION TO MPPT
1. GENERAL INFORMATION
– What is the meaning of MPPT?
The meaning of the MPPT is “Maximum Power Point Tracer”. We use it in a solar charge controller. This is neither a component nor a circuit. It is just a method that we use in control devices.
– Why do we need them?
With this method, we can access the maximum power that solar panels can give us with respect to the solar radiation at that moment.
– What is the ‘Maximum Power Point’?
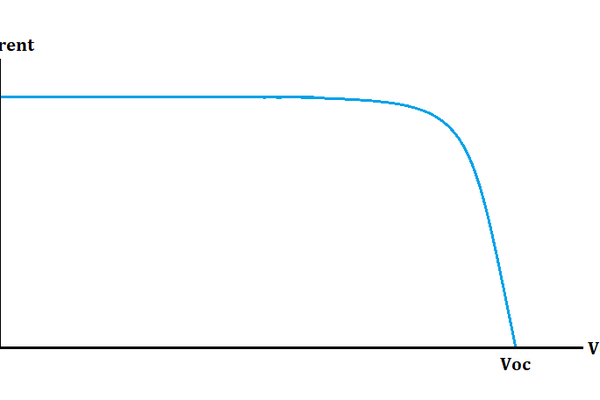
Before we discuss that first, we have to learn about the solar panel characteristic curve (graph 1).
This type of graph is called the I-V curve. ‘Isc’ is short-circuit current and ‘Voc’ is open-circuit voltage. Usually, you can see them on the backward of the panels at standard test conditions. Open circuit voltage is the maximum voltage and short circuit current is the maximum current that a solar panel can reach. It depends on the heat and solar radiation but for now, we will discuss it later. If we add the power curve to this graph, it will look like (graph 2).
As you can see the power line starts from zero and before the peak it continues like a linear line. The reason is voltage is changed but current can not go further than Isc. That peak power is our maximum power point. That means we can not produce more power than the peak point.
– What happens if we use solar panels directly?
We can explain it easily with an example. Let’s say we have a solar panel that Voc is 22V and Isc is 0.62A. Also, MPP is 10W. And we want to charge a 3.7V battery. If we directly connect them, the voltage will be 3.7V and the solar panel can only produce 0.62A. That means, our output power is 2.3W! we lost 7.7W power. If we had been using an MPPT device, it had been checking the input voltage, found the maximum power, and gave it to us. In this case, we can charge the battery with 2.7A.
– How do MPPTs work?
It checks the input voltage and current. It requests more power from the solar panel and if the solar panel can supply it, then it will ask for more until the solar panel can not afford the requested power. This means, our tracker found the MPP. After, it tries to hold the point if the power does not change. However, in real life, MPPT can not just hold a point, it swings at that point. Because it is always in a search for MPP.
2. DIFFERENT MPPT METHODS
There are many types of MPPT algorithms. MPPT methods can vary depending on different purposes. Convergence speed of the MPP, number of sensors used for the tracking, cost, etc. These parameters are directly related to our chosen method. In this paper, I am not going to describe all these methods but if you are interested in learning more, you can easily google these keywords;
- Incremental Conductance (IC) Method
- Constant Voltage Method
- Temperature Method
- Open Voltage Method
- Feedback Voltage (Current) Method
- Fuzzy Logic Control
As you can see, there are several different methods. To say one of them is perfect is difficult because they have pros and cons, so it depends on the application. In this paper, we will use the “Perturbation & Observation Method”. Therefore I did not add it to the list above.
Step 2: PERTURBATION & OBSERVATION METHOD
1. ALGORITHM
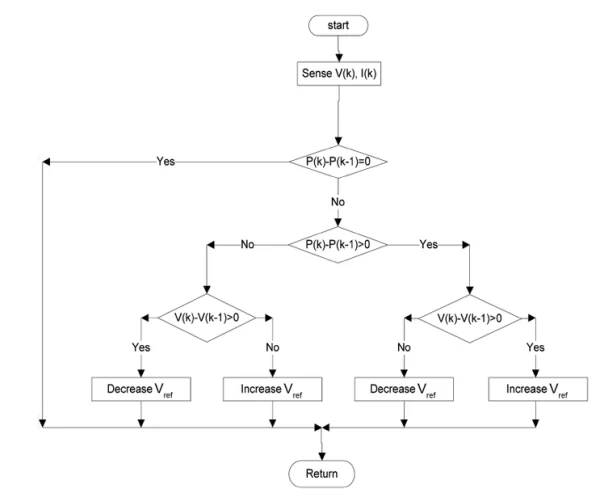
For this project, I chose the common and effective method called ‘Perturbation & Observation’ (Graph 3)
– How do this method work?
For clarity and a better understanding, we have to look at each part separately in this method
(Graph 4).
First, the algorithm reads the solar voltage and current value. Our first reading is shown as (1) second is (2) and it goes on like this. We assume that it is as shown in (Graph 4).
(Graph 5)
Next, the algorithm calculates the power shown as P(1). The initial value of voltage, current, and power assumed 0. It controls the difference between two power points. If there is no change between the two’s, it just returns the start position. In reality, we need to discuss this condition too but to understand the general idea, we can ignore this. If there is any change between those, the algorithm can skip to the next condition.
(Graph 6)
The algorithm has to compare if P(1) is bigger than P(0) because the algorithm has to know the exact point.
(Graph 7)
As you can see, the difference between power can be in LHS or RHS and move upwards or downwards. If the difference is bigger than 0, the algorithm knows it goes upwards, If not, it goes downwards. However, it still can’t find the side, so it has to look for the movement of voltage. In our case, P(1) is bigger than P(0).
(Graph 8)
The algorithm compares the voltage differences and decides the direction of the motion which is LHS or RHS. In our case, V(1) is bigger than V(0).
(Graph 9)
After the algorithm decides on motion direction, it increases or decreases the reference voltage. The reference voltage is actually the solar voltage value. If we decide to increase reference voltage, that means, we have to increase the solar voltage. After increasing the solar voltage, the algorithm starts to check where motion is again until it finds the MPP. For better understanding, we need to discuss what the duty cycle is and what a ‘buck converter’ is, we will talk about them in STEP 3.
– ΔPower = 0 Condition
(Graph 10)
This graph shows power-voltage curves with respect to different solar radiations. Red dots are the MPPs. As you can see, solar radiation can change the maximum power point and open-circuit voltage. That means power can remain the same although MPP is changed.
(Graph 11)
Blue dots show equal values of power curves. As you can see, solar radiation can change but power can stay the same.
– Overall Table
(Graph 12)
2. PROBLEMS
– Drifting Problem
This problem can be explained basically like this, let’s think available solar radiation is 400 W/m2. P&O algorithm consistently searches for MPP and it fluctuates as much as ΔV at point A. However, if the power curve increases to 600 W/m2, the algorithm thinks power and voltage increase. So that, the reference voltage will shift to the right and move away from MPP.
(Graph 13)
– What are the pros and cons?
Pros;
- Simple structure
- Doesn’t need pre-defined solar panel features(Vmpp, Isc eg.)
Cons;
- Reference voltage drafts away for unstable weather conditions.
- Depends on the reference voltage step, fluctuation increases on the MPP.
Step 3: DESIGN RULES TO KNOW
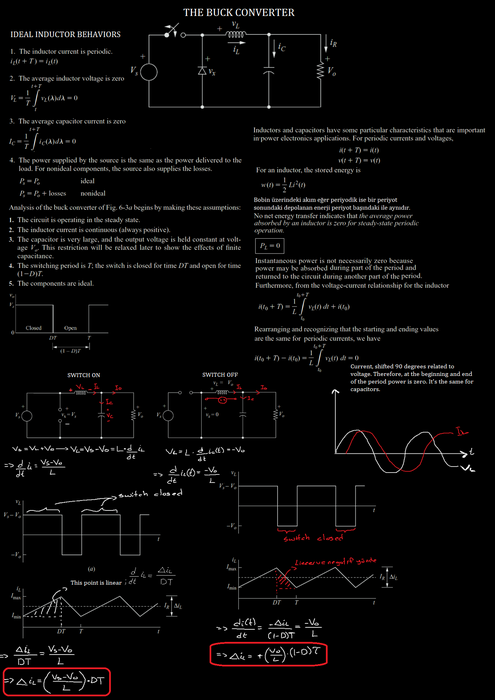
1. BUCK CONVERTER TOPOLOGY
The first and second notes are for the topology.
2. SYNCHRONOUS AND ASYNCHRONOUS BUCK CONVERTERS
The third note is for this.
3. DUTY CYCLE
The fourth one is for this. The duty cycle can be calculated with the ON time divided by the period. In this way, we can adjust the voltage level with alter the duty cycle as I explained above.
Step 4: BLOCK DIAGRAM OF THE CIRCUIT
1. SIMPLIFIED BLOCK DIAGRAM
First one is the simplest block diagram of the circuit. This way, when I design a circuit, I can see what I need clearly.
– Solar Panel
I used a solar panel that has many features shown above. There is no additional advantage or specialty of the panel, the reason for my choice is because I already have it.
– Load
As a load, I want to charge LI-ION batteries. In this way, I can charge my phone or anything that can be fed with 5V.
– MPPT
This part is the MCU part. The Circuit board will be controlled by this controller. MCU will drive the DC-DC buck converter and LCD. Also, it will read the input voltage, current, and heat of the MOSFETs.
– LCD
I want to show some data on LCD. So that I don’t have to connect MCU to the computer every time. Also, I want to use the final product outdoor which will be easier to use.
– DC-DC Buck Converter
This is actually the main converter for the MPPT. This is going to be a synchronous buck converter. The reason is that the synchronous version is more efficient than the asynchronous version. Solar input power is not that much so I need to make this conversion as efficient as possible.
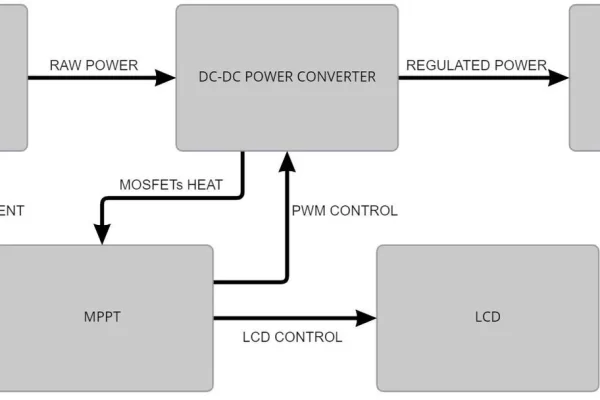
2. DETAILED BLOCK DIAGRAM
After I make a basic block diagram of the circuit, I like to add more details to see what I need. The third one is showing the detailed version.
Before I printed the circuit board, there was a current sensor for the output of the buck converter too. But thanks to my bad luck, the first current sensors that I ordered were faulty. So I decided to change it to another IC. Because of budget problems, I couldn’t buy two. So I decided to use the current sensor only for input.
Backflow current control unit has two advantages. The first one is separating the solar ground and load ground. If this application were a high input voltage application, it would be beneficial to use. The second one is it blocks the backflow current coming from the buck converter. It’s important because solar input voltage can be less than the output battery voltage and current can flow from batteries to panels.
The heat sensor is optional. In our case, current not be that much to heat MOSFETs. But for safety, it will be good to see it. So that, we can on and off the load MOSFETs.
I had bought a MOSFET driver earlier so I have had to add a 10V boost converter to the system because it is working between 10-20V. Also, I used the Arduino UNO board so I supply it with 10V too. It’s not an efficient way but as I said before, I tried to use components that I already have.
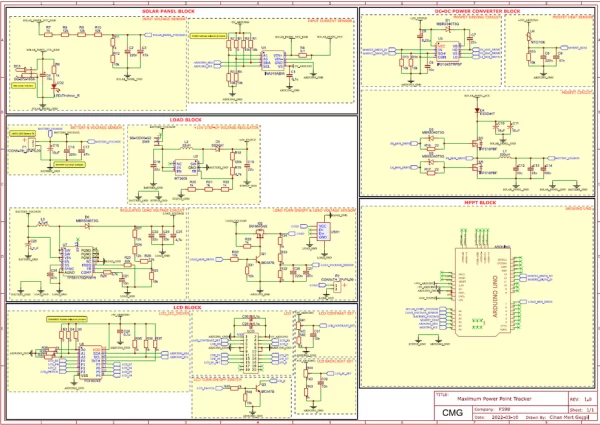
Step 5: SCHEMATIC
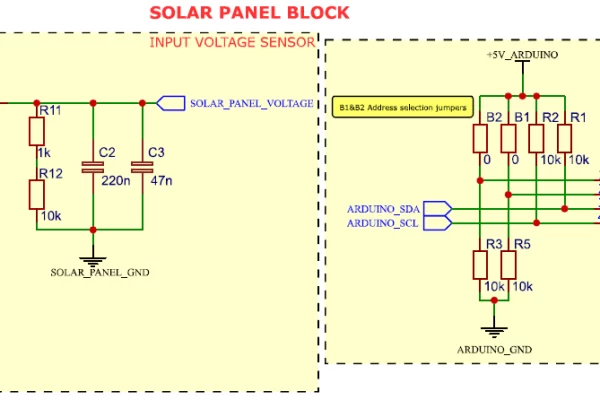
1. SOLAR PANEL BLOCK
– Input Voltage Sensor
The input voltage sensor is a voltage divider circuit. C2 and C3 caps are used as a decoupling for ADC. I will share my design preferences too. I ordered some resistors and in the designing process, I try to reach the exact values of the resistors with my resistor values. That’s why they were so many. Also, I added a LED indicator for the input voltage.
– Input Current Sensor
I used 3 different ways for the input current sensor. My first choice was ACS712. It’s a very precise IC but for my circuit, read current steps are so wide. My solar panel’s short circuit is about 700mA and that IC can read 30A on both sides. So I tried to make my current sensor with OPAMPs. Unfortunately, it couldn’t be precise and has a very large reading tolerance. I can share my high-side current reading with differential amplifier notes later. Next, I decided to use MAX471 IC. It’s the same thing with high-side current sensing with the differential amplifier, but all circuits are in a package, even the shunt and gains resistors. It could be perfect but as I said, they came faulted to me so I couldn’t use them. Finally, I found INA219. It’s a very precise IC and has adjustable gain also it communicates with the I2C protocol. I will share my design notes for this IC too.
2. DC-DC POWER CONVERTER BLOCK
– Mosfet Driving
IR2104 is easy to use and you can drive both MOSFET.
IMPORTANT: C7 bootstrap capacitor should be more than 100nF. Keep in mind to replace it with 100nF or higher value. In addition to this, I accidentally drew the C7 capacitor between the D1 diode and HO pin which is really important. It should have been between D1 and VS. Even though I changed it from the schematic, it still stays on the PCB drawing.
– Mosfet Heats
The heat sensor is a voltage divider and I feed them with 3.3V because I already have 3.3V on the Arduino board. It will consume less energy in this way.
– Mosfet
For the MOSFET circuit, I will share an excel file and you can design your circuit with that calculator. I split the total capacitance into three parts so the output voltage ripple decreased. L1 inductance value is high because Arduino switching frequency is low. I used 31kHz frequency on the D11 pin of the Arduino. I used the D4 diode as a BCCU because there is no need to separate input and output grounding. Input is not that high. But still current can flow from the battery to the solar panel. D4 will eliminate that.
3. LOAD BLOCK
– Battery & Voltage Sensor
C16 and C17 are decoupling capacitors. I used two LI-ION batteries in parallel. So I don’t need a voltage divider, batteries are already in a 5V range. But I made a mistake and unfortunately, I noticed it after the PCBs came to me. If you directly connect the batteries to the Arduino analog pin, the Arduino is supplying itself from the batteries and it can’t be completely turned off if you don’t disconnect the batteries.
IMPORTANT: I should have added a pull-down resistor between Battery_Voltage and the ground. Even though batteries are not connected to the P1, I still saw some voltage because C16 and C17 loaded from analog pins.
– 10V Step-Up Voltage Regulator
I put a switch there because if I close the switch, 10V can’t supply the MOSFET driver and Arduino. So I can turn on and off the circuit. I made this circuit by following the datasheet’s suggested values.
IMPORTANT: I changed the R20 with a 4.7k resistor. Because output voltage was higher than 10V.
– Regulated Load Voltage
I made this circuit by following the datasheet’s suggested values. As you can see, the grounds are separate and connected to another place. This is not a necessary thing. I did it just to see them one by one.
– Load Turn ON/OFF & Load Voltage
I made this circuit for protection. It will cut the circuit over or under-voltage situations. Also, the output can only be open if Arduino can be turned on.
4. MPPT BLOCK
Pin 11 is a PWM pin and PWM frequency can increase 31kHZ.
IMPORTANT: You don’t have to connect pull-up resistors for all the I2C IC. Just one pull-up is enough for one bus.
5. LCD BLOCK
I used a 16×2 LCD and drive it with I2C.
IMPORTANT: I make the LCD contrast setting R42 short-circuit because contrast increased when voltage is close to the GND. Change the places in R42 and R41 instead of each other.
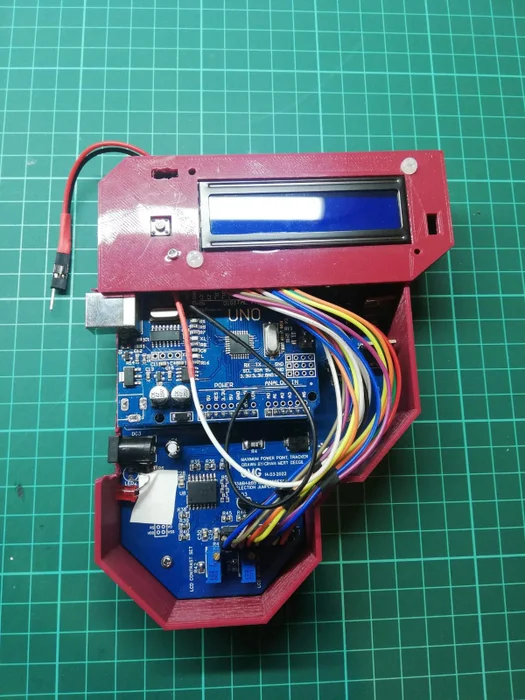
Step 6: PCB
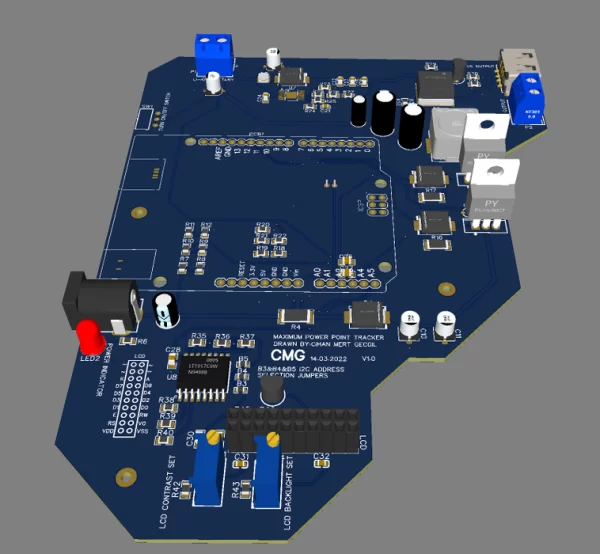
I designed the PCB using EasyEDA and ordered it from JLCPCB. the EasyEDA is easy to use and if you want to order the PCB, you can
directly order it from EasyEDA. I used the default settings for order parameters.
I used both sides of the PCB. The board is quite huge. The reason I soldered with solder-station is that I wanted to give myself some space.
Also, I wanted to connect Arduino to the board with headers and it took some space.
I changed that awful-looking electrolytic capacitor (6th picture) with an SMD capacitor. If you want to use both sides of the circuit board, you shouldn’t put electrolytic caps under it. It can not stay still on the table.
Step 7: CODES
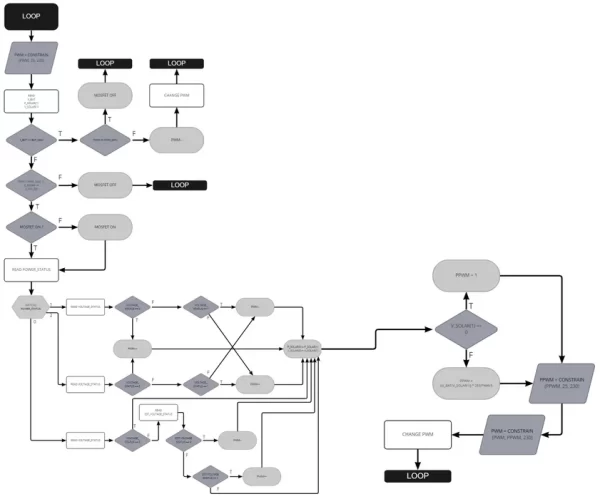
This is the flowchart for the MPPT algorithm. The algorithm works like this. First, we make sure PWM is between the pre-defined maximum and minimum values. The reason is that MOSFETs act unstable under or above these values. PWM is between 0-255. I defined 25 as the minimum. If PWM gets low, that means the duty cycle will be less and low-side MOSFET will be ON more. In this case, low-side MOSFET acts like a short circuit at some point, and current flow increases as much as that MOSFET can’t handle. That burns the MOSFET. For the high-side MOSFET, if PWM is 255 that means the duty cycle will be %100. But in reality, it doesn’t work like this. Duty cycle increase like %97-98. Also increases PWM on high-side MOSFET results in the gate voltage being high. For a more reliable circuit, defining upper and lower limits is a good solution. At the beginning of the loop, we make sure PWM is between the limits. After that, we can read the battery voltage, input solar voltage, and power. The batteries are LI-ION so the output voltage shouldn’t be higher than the suggested maximum voltage of 4.2V. We need to make sure the output voltage is under this voltage. If it’s higher than the max., we control the PWM. If it’s already at the minimum, to protect the batteries we close the MOSFETs. If it is not in the minimum value, PWM is decreased and turns back to the beginning of the loop. If the output voltage is under 4.2V, we check the input solar voltage. Because we defined a maximum PWM value and that means we have a maximum duty cycle value. if we think that the output voltage is at the maximum and we also think that we have an upper limit for the duty cycle, we have a minimum voltage limit for the input.
Vin * D = Vout
Vout/Vin = D
if Vout = Vout(max). To find the D(max) value, a Vin = Vin(min) is needed. So if we already have a D(max), that means in this equation, Vmin has to be the minimum value.
So we control the input with that minimum value. If the input is under the minimum, we close the MOSFETs. The other step is to check whether MOSFETs are on or off. If it is off, we make it on and continue. Then we control the power status. Power status means ΔP. So we check the ΔP status that can be below zero, above zero, and equal to zero. There is an additional status for the P = 0. If we update the above table that is in the algorithm section, it will look like the 2nd picture.
As additional information, duty cycle and Vref are the inverse ratios. If the duty cycle is increased, Vref is decreased or vice versa. Actually, Vref is not a real voltage value. It is a guess of voltage. In the V-I curve, we use the Vref variable for what voltage we expect in the next step. We can think like this, for example, we have a ball and we throw that ball wherever we want it to go. Then, we walk to the ball. We take the ball and again we throw the ball wherever we want it to go. We can think the ball is Vref and the walking person is the real input voltage. If we throw the ball in the wrong place, we try to find the look to correct way for getting the ball. That means to increase the duty cycle, the input voltage has been decreased, or to decrease the duty cycle, the input voltage has been increased. The duty cycle is directly related to PWM and they are directly proportional. PWM is 0 means duty cycle = %0 and PWM is 255 means, duty cycle = %100. We can adjust the duty cycle by using PWM so we can change Vref with PWM in the table. Numbers are for indicating the status of voltage and power. If both numbers are zero, we do nothing for PWM. But if power is equal to zero and voltage has changed, we need to follow a different algorithm.
(3rd picture)
As you can see on the graph, blue dots indicate the same power level. At those points, power can stay the same but the voltage could have been changed. That looks like cheating but to define this status, we can define the MPP for the algorithm. So that the algorithm can find out the where voltage is. If the read input voltage is left or right of the predefined maximum power point, PWM will change depending on this information. For finding the MPP point, I took the %70 of the open-circuit voltage. So for 22V, MPP will be around 15V. We have to make a decision before choosing the MPP. As you can see in the graph, MPP drifts right when solar radiation is increase. If we make a decision thinking of high-level solar radiation, for those points MPP point will be found in a more correct way. The same thing is correct for low-level solar radiations. I chose the voltage which I can find a middle point. So that both sides have equal distance. I control this status by using EST_VOLTAGE_STATUS. So if we update the table again it will look like this:
(4th picture)
After the decision on the PWM value, we assign the power and voltage values as the previous values. So that, when we read the new values, we can compare them with previous values. Then we set the PPWM called predicted PWM. PPWM is found by output and input voltage ratio. If the input voltage is 0, PPWM will be 1. If not, we scale the ratio by 255. 0,995 value is the error correction for calculated PPWM. Also, we have to make sure PPWM is in the minimum and maximum range. This value will be the bottom limit for PWM.
There is an important point. As you can see, we didn’t use the CC mode for charging the batteries we just control the maximum battery voltage level. We don’t have a current sensor for the batteries and we can’t read the current flow through the batteries. Maybe it can be calculated with the input power times efficiency equation but to make the process easy I didn’t use it. Batteries are charging only using CV mode.
I will share the whole code with you and you can take references or change it for your purposes.
- What MPPT method is used in this project?
The Perturbation & Observation (P&O) method is used. - Can I use the provided design as-is for an efficient MPPT?
No, the author states this design is not the most efficient or cheapest and should be used as a reference. - Does the project include input current sensing?
Yes, input current sensing uses the INA219 after other options proved unsuitable. - How is the DC-DC converter implemented?
As a synchronous buck converter driven by MOSFETs and an IR2104 driver. - What protections are included for the battery/load?
Over/under-voltage protection, backflow current control using a diode, and PWM limits to protect MOSFETs and batteries. - Do I need pull-up resistors for each I2C device?
No, only one pull-up resistor is needed for the I2C bus. - How is PWM limited and why?
PWM is constrained between predefined min and max (example min 25) to prevent MOSFET instability and thermal damage. - What warning is given about connecting batteries to Arduino analog pins?
A pull-down should have been added because batteries can feed analog pins and keep the Arduino powered; decoupling caps can hold voltage on pins. - Where was the PCB ordered and what design tool was used?
The PCB was designed in EasyEDA and ordered from JLCPCB using default order settings. - Is the source code provided for the MPPT algorithm?
The author states they will share the whole code for reference and modification.