Summary of Arduino Geiger–Müller counter with LCD display
This article details an Arduino-based project that interfaces with a Geiger-Müller counter to collect radiation data and display it on a Nokia 5110 LCD. The system features two visualization modes: a one-minute pulse bar graph and a four-minute data histogram, both with auto-ranging Y-axes. The hardware utilizes an Arduino Uno paired with a modified homemade shield and the LCD screen, while the software relies on specific third-party libraries installed via the Arduino IDE.
Parts used in the Arduino Geiger–Müller Counter:
- Arduino Uno
- Nokia 5110 LCD
- Homemade shield (modified from a freely available design)
- Geiger–Müller counter
- Third-party libraries for Arduino IDE
In the previous posts I’ve described a simple Geiger–Müller counter and various experiments with this device. Today I would like to present Arduino project to communicate with a Geiger-Muller counter, gather data and present it to the user. The device is based on Arduino Uno, Nokia 5110 LCD and homemade shield.
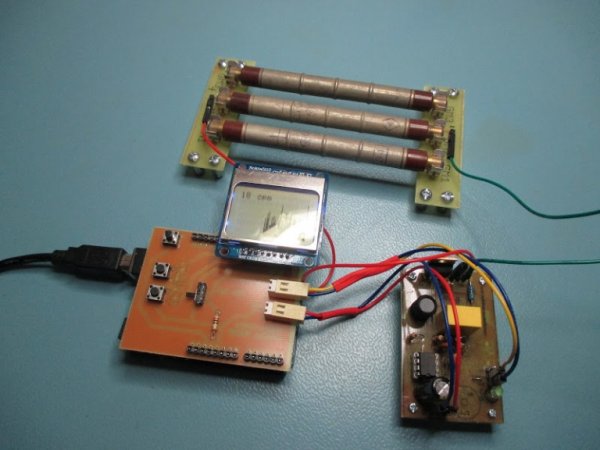
Currently it’s possible to show two layouts: bar graph of the pulses in one minute interval and histogram of the gathered data. Both graphs are auto-ranging in Y axis. On the top of the pulse graph is visible also a numeric value of the last sample. The length of the histogram data is 4 minutes, the amount of bins is calculated automatically.
Below is visible layout with pulses per quant of time and histogram of them. You can clearly observe Gaussian distribution on the second image.
Hardware
I didn’t want to place all of the connections and input PCB dimensions of a shield, so I’ve used as a base one of freely available shields and modified it to my needs – I’ve left the licence disclaimer unmodified. Unfortunately, I wrongly connected LCD, that’s why the LCD looks like rotated 180 degrees. Anyway, it still works and I don’t plan to make a new PCB to fix it.
I tried to make the code reusable in my other projects so the structure may look overcomplicated, but I think it’s as it should be.
Software
Followed 3rd party librairies needs to be installed, to install them in Arduino IDE go to sketch -> Include Library -> Manage Libraries then type library name and proceed with installation.
Read more: Arduino Geiger–Müller counter with LCD display
- What components form the basis of this device?
The device is based on an Arduino Uno, a Nokia 5110 LCD, and a homemade shield. - How many layouts can the device display?
Currently, it is possible to show two layouts: a bar graph of pulses and a histogram of gathered data. - What is the time interval for the pulse bar graph?
The bar graph displays pulses in a one-minute interval. - How long is the histogram data length?
The length of the histogram data is 4 minutes. - Can the graphs adjust their scale automatically?
Yes, both graphs are auto-ranging in the Y axis. - Where is the numeric value of the last sample visible?
The numeric value of the last sample is visible at the top of the pulse graph. - How does the system calculate the amount of bins?
The amount of bins is calculated automatically. - Why does the LCD appear rotated 180 degrees?
The LCD looks rotated because the author wrongly connected it during assembly. - How do you install the required third-party libraries?
You must go to sketch, then Include Library, Manage Libraries, type the library name, and proceed with installation. - Is the code structure designed for reuse?
Yes, the author tried to make the code reusable for other projects.