Summary of Arduino Based Real-Time Oscilloscope
This project builds a cost-effective 4-channel Arduino-based real-time oscilloscope: the Arduino’s ADC samples an analog input, sends readings over UART to a Python plotter, and the Python script (using pyserial, matplotlib, drawnow) handshakes with the Arduino to plot live waveforms. The example uses an LDR in a voltage divider as the test signal. Schematics, Arduino sketch, and Python plotter code (including serial setup, buffering, and plotting routine) are provided to visualize ADC outputs in real time.
Parts used in the Arduino Based Real-Time Oscilloscope:
- Arduino Uno (or other compatible Arduino board)
- Breadboard
- 10k Resistor (1)
- LDR (1)
- Jumper wires
- PC with USB cable for serial communication
Arduino Based Real-Time Oscilloscope
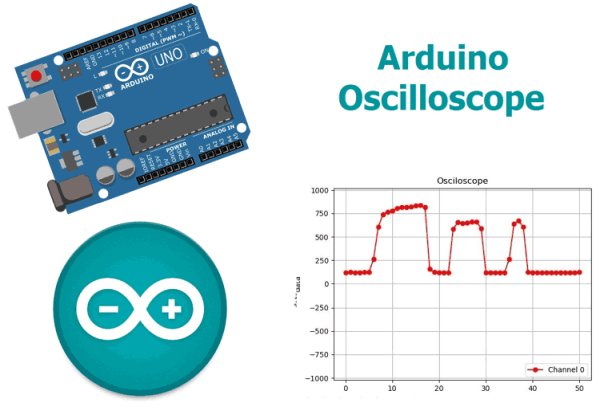
The Oscilloscope is an essential instrument for the workbench of every electronics engineer or maker. It is primarily used for monitoring waveforms and analyzing voltage levels, frequency, noise, and other signal characteristics that can change over time at its input. Embedded software developers utilize it for code debugging while technicians depend on it for troubleshooting electronic devices during repairs. Engineers rely on the oscilloscope for a multitude of important reasons. The primary issue is the expensive price; Entry-level oscilloscopes can vary in price from $45 to $100 with restricted precision, whereas higher-end models may exceed $150. Today, I will demonstrate the process of making a cost-effective 4-channel Arduino oscilloscope using Arduino and Python programming, which can perform functions such as showing waveforms and gauging signal voltage levels, like certain low-priced oscilloscopes.
How it works
There are two parts for this project;
- The Data Converter
- The Plotter
Oscilloscopes commonly show a visual representation of an analog signal connected to their input channel. To achieve this, the first step is to convert the analog signal to digital, then proceed to graph the data. We will use the ADC on the atmega328p microcontroller, like the Arduino, to change analog data to a digital signal input. After transforming, the Arduino transmits the value to the PC using UART. The Python-based plotter software being developed will plot each data point with respect to time to create a waveform.
Required Components
The following components are required to build this project;
- Arduino Uno (Any of the other boards can be used)
- Breadboard
- 10k Resistor (1)
- LDR (1)
- Jumper wires
Required Softwares
- Arduino IDE
- Python
- Python Libraries: Pyserial, Matplotlib, Drawnow
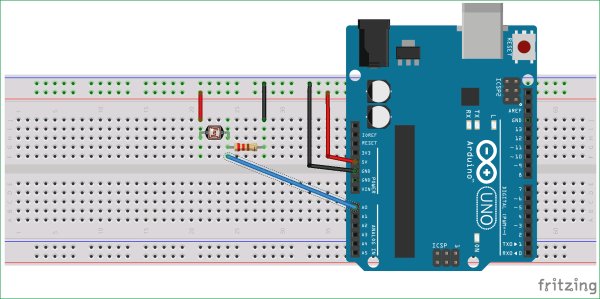
Schematics
The Arduino Oscilloscope has a simple design. Just attach the signal being tested to the specified Analog pin on the Arduino. However, our intention is to use the LDR in a simple voltage divider setup to generate the signal for analysis, where the resulting waveform shows the voltage level based on the nearby light intensity detected by the LDR.
Match the components based on the diagrams given.
After connection, the setup should like the image below.
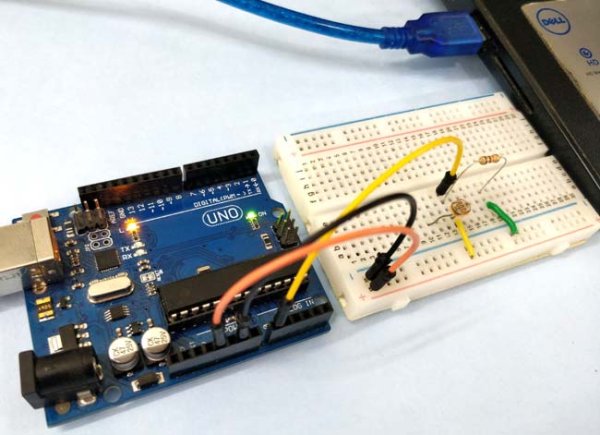
With the connections all done, we can proceed to write the code.
Arduino Osclloscope Code
Codes will be created for both sections. To create the Plotter, a Python script will be coded to receive data from the Arduino through UART and generate plots. For the converter, an Arduino sketch will be written to receive data from the ADC and convert it into voltage levels to be sent to the plotter.
Python (Plotter) Script
Starting with the more complex Python code.
The previously mentioned python script will incorporate drawnow, Matplotlib, and Pyserial libraries. Pyserial allows for the creation of python code that can communicate through a serial port, Matplotlib allows for the generation of plots using data from a serial port, and drawnow enables the plot to be updated in real-time.
Installing these packages on your computer can be done easily using pip. Pip is easily installable via the command line on a Windows or Linux system. I suggest installing python3 and ticking the box to include python in path, as PIP is included with python3. If you face issues with pip installation, refer to the official python website for help.
With pip successfully installed, we can now move on to installing the required extra libraries.
Go to the command prompt for Windows, or terminal for Linux, and enter the specified command.
pip install pyserial
With this done, install matplotlib using;
pip install matplotlib
Drawnow is sometimes installed alongside matplotlib but just to be sure, run;
pip install drawnow
With the installation complete, we are now ready to write the python script.
The python script for this project is similar to the one I wrote for the Raspberry Pi Based Oscilloscope.
We start by importing all the libraries needed for the code;
import time
import matplotlib.pyplot as plt
from drawnow import *
import pyserial
Next, we create and initialize the variables that will be used during the code. The array val will be used to store the data received from the serial port and cnt will be used to count. Data at location 0 will be deleted after every 50 data counts. This is done to keep the data being displayed on the oscilloscope.
val = [ ] cnt = 0
After that, we generate the serial port object that the Arduino will use to interact with our python script. Make sure that the com port mentioned is the one your Arduino board is using to communicate with the IDE. The 115200 baud rate was employed to guarantee rapid communication with the Arduino. In order to avoid mistakes, it is necessary to activate the Arduino serial port in order to communicate at this baud rate.
port = serial.Serial(‘COM4’, 115200, timeout=0.5)
Next, we make the plot interactive using;
plt.ion()
we need to create a function to generate the plot from the data received, creating the upper and minimum limit we are expecting, which in this case is 1023 based on the resolution of the Arduino’s ADC. We also set the title, label each axis and add a legend to make it easy to identify the plot.
#create the figure function
def makeFig():
plt.ylim(-1023,1023)
plt.title(‘Osciloscope’)
plt.grid(True)
plt.ylabel(‘ADC outputs’)
plt.plot(val, ‘ro-‘, label=’Channel 0′)
plt.legend(loc=’lower right’)
Having completed this task, we can now proceed to develop the main loop which retrieves data from the serial port once it becomes accessible, and then displays it graphically. In order to sync with the Arduino, the python script sends a handshake data to show that it is ready to receive data. Once the Arduino gets the handshake data, it responds with data retrieved from the ADC. If we don’t have this handshake, we can’t visualize the data instantly.
while (True):
port.write(b’s’) #handshake with Arduino
if (port.inWaiting()):# if the arduino replies
value = port.readline()# read the reply
print(value)#print so we can monitor it
number = int(value) #convert received data to integer
print(‘Channel 0: {0}’.format(number))
# Sleep for half a second.
time.sleep(0.01)
val.append(int(number))
drawnow(makeFig)#update plot to reflect new data input
plt.pause(.000001)
cnt = cnt+1
if(cnt>50):
val.pop(0)#keep the plot fresh by deleting the data at position 0
The complete python code for arduino oscilloscope is given at the end of this article shown below.
Arduino code
The second code is the Arduino sketch to obtain the data representing the signal from the ADC, then wait to receive the handshake signal from the plotter software. As soon as it receives the handshake signal, it sends the acquired data to the plotter software via UART.
We start by declaring the pin of the Analog pin of the Arduino to which the signal will be applied.
int sensorpin = A0;
Next, we initialize and start serial communication with a baud rate of 115200
void setup() {
// initialize serial communication at 115200 bits per second to match that of the python script:
Serial.begin(115200);
}
Lastly, the voidloop() function which handles the reading of the data, and sends the data over serial to the plotter.
Read More Information….
Arduino Based Real-Time Oscilloscope
- What is the basic principle behind this Arduino oscilloscope?
The Arduino ADC converts analog signals to digital values which are sent over UART to a Python plotter that graphs the values versus time. - Which Arduino pin is used for the signal input?
The article uses analog pin A0 as the signal input. - How does the Python plotter receive data from the Arduino?
The Python script uses pyserial to open a serial port, sends a handshake byte, and reads ADC values sent by the Arduino. - What Python libraries are required for the plotter?
Pyserial, Matplotlib, and Drawnow are required. - What baud rate should be used for serial communication?
The article uses 115200 baud to match between Arduino and the Python script. - How is the test signal generated in the example?
The example uses an LDR in a simple voltage divider to produce a varying voltage based on light intensity. - How does the Python script keep the plotted data from growing indefinitely?
The script appends new readings to an array and pops the oldest value after a set count (after 50 samples) to keep the plot fresh. - What function updates the real-time plot in Python?
drawnow is used along with a makeFig function and plt.pause to update the plot in real time. - What must the Python script send to the Arduino to start receiving data?
The script writes a handshake byte b's' to the serial port to indicate readiness. - What ADC resolution limit is assumed in the plot settings?
The plot uses 1023 as the upper ADC limit corresponding to the Arduino ADC resolution.