Summary of Arduino Air Quality Sensor
Summary This module describes building a low-cost air quality sensor using an Arduino (or compatible board), a Plantower PM sensor, optional I2C LCD, and microSD logging, including wiring, code, Python plotting, calibration notes, and classroom research ideas for measuring PM1.0, PM2.5, and PM10 with laser-scattering sensors.
Parts used in the Air Quality Sensor Project:
- Arduino Uno or compatible board (e.g., SparkFun RedBoard)
- USB cord or 9V battery adapter for power
- Plantower particulate matter sensor (models 1003, 3003, 5003, or 7003)
- Breadboard
- Male-to-female jumper wires
- 16x2 I2C LCD screen with I2C adapter board
- MicroSD card reader/writer module
- MicroSD card (FAT16 or FAT32, <32 GB)
- Optional: computer with Arduino IDE and Python installed
Summary
The issue of poor air quality is a significant concern that impacts the well-being of numerous communities, particularly individuals with health conditions. The ability to measure air quality accurately is of utmost importance. In this module, you will have the opportunity to construct a basic air quality sensor using affordable and easily accessible components.
Materials & Methods
- The hardware components required for this project include an Arduino Uno board or an equivalent model, such as the one available at https://www.sparkfun.com/products/12757. It is worth noting that we have used various inexpensive models from Amazon and SparkFun RedBoards, all of which have performed equally well as the traditional Arduino Uno.
- To power the board, you can utilize a USB cord connected to a phone charger, a phone external battery, or a computer. Alternatively, you can use a 9V battery connection with an adapter like the one found at https://www.amazon.com/IDS-Battery-Power-Cable-Arduino/dp/B072PTY1WM/ref=sr_1_7?ie=UTF8&qid=1525987560&sr=8-7&keywords=arduino+9v+battery+adapter&dpID=41m3xLRH-0L&preST=_SY300_QL70_&dpSrc=srch.
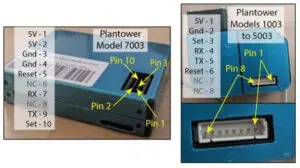
- The air quality sensor employed in this project is sourced from Plantower (http://www.plantower.com/en/). Our code is compatible with several models, including 1003, 3003, 5003, and 7003. However, please note that in the Arduino code, you will need to modify the variable “LENG” according to the specific model being used. The code contains detailed comments to guide you through this process. You can readily purchase these sensors from various sources.
- To simplify the process of connecting wires for 5V and ground, a breadboard and male-to-female jumpers are recommended. A breadboard provides a convenient platform for organizing and connecting the necessary wires, especially when utilizing all the optional components in this module. Alternatively, you can create your own multi-pronged wires for 5V and ground by soldering.
- You can find a variety of breadboards and jumpers on Amazon at the following links:
– Breadboards: https://www.amazon.com/s/ref=nb_sb_noss_1?url=search-alias%3Daps&field-keywords=breadboard
– Male-to-Female Jumpers: https://www.amazon.com/Foxnovo-Breadboard-Jumper-Wires-Female/dp/B00PBZMN7C/ref=sr_1_1?s=electronics&ie=UTF8&qid=1525989304&sr=1-1&keywords=female+to+male+jumpers&dpID=51is6kX6ZsL&preST=_SY300_QL70_&dpSrc=srch - When it comes to visualizing particulate concentration, you have several options to choose from, depending on the level of involvement you desire. It is important to note that these low-cost air quality sensors provide a relative estimation of particulate matter (PM) concentration. To obtain accurate estimates, calibration of the sensor for the specific types of particles being observed is necessary.
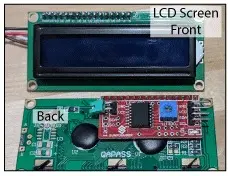
We have incorporated a 16-column by 2-row LCD screen with the I2C Arduino package for this project. The provided code will display various information such as the time elapsed since the Arduino was powered up, PM1.0, PM2.5, and PM10 concentrations. Numerous LCD screens are available in the market that can be used for this purpose. We have utilized one from Amazon, ensuring that it includes the necessary board requiring only 4 wires for connection. Please note that when selecting an LCD screen, ensure it is not just the screen itself but also includes the required board. Here is an example from Amazon: https://www.amazon.com/FICBOX-Serial-Backlight-Display-Arduino/dp/B071XP6PPT/ref=sr_1_5?ie=UTF8&qid=1525383666&sr=8-5&keywords=lcd+screen+arduino
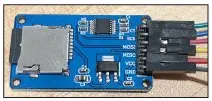
A microSD card reader is essential for recording data over extended periods, which can be later analyzed on a computer. You will also need a microSD card for storage. It is recommended to use a card with a capacity smaller than 32 GB and ensure that it is formatted as FAT16 or FAT32 (most cards come pre-formatted, but reformatting may be required for certain models).
Here are links to examples of microSD card readers available on Amazon:
– MicroSD Card Reader Adapter Module for Arduino: https://www.amazon.com/SenMod-Adapter-Reader-Module-Arduino/dp/B01JYNEX56/ref=sr_1_1_sspa?s=electronics&ie=UTF8&qid=1525987957&sr=1-1-spons&keywords=sd+card+reader+arduino&psc=1
– MicroSD Card (for storage): https://www.amazon.com/gp/product/B00MHZ70KO/ref=oh_aui_detailpage_o00_s00?ie=UTF8&psc=1
For monitoring the particulate concentrations, you can use the serial monitor in the Arduino sketch editor by connecting the Arduino to your computer via USB. To access the serial monitor, you can use the keyboard shortcut “Ctrl + Shift + M” or navigate to it through the “Tools” menu.
Additionally, if you have Python installed on your computer, the Python script provided at the end of this module can be used to create real-time plots of air quality.
Other Materials you May Want:
Timekeeping: It is important to note the starting time for each sensor. The Arduino will record data with the first reading at t = 0, and it is crucial to know the corresponding time of day for accurate data analysis.
GPS: If you wish to compare your readings to those taken at different locations, you may want to measure your precise location. You can access GPS data from various phone map or compass apps, or you can retrieve the location later by using Google Maps and clicking on the specific data collection locations.
Weather Station: Temperature, pressure, and wind velocity in your area may be of interest, but keep in mind that this data can also be obtained from weather websites, although with potentially lower resolution.
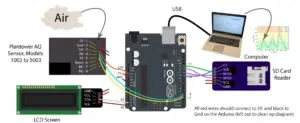
Wiring: The Arduino, sensor, LCD screen, and SD card reader should be interconnected according to the provided instructions. However, if you prefer to read data through a computer, you can omit the LCD screen or SD card reader. Please note that the wiring diagram depicted is applicable to all models except for the 7003; refer to the image of the 7003 sensor above for the appropriate wiring modifications specific to the AQ sensor.
Wiring Table:
|
Plantower |
Plantower |
Goes To |
SD Card |
Goes To |
LCD I2C Screen |
Goes To |
|
1 |
1 or 2 |
5 V |
CS |
10 |
GND |
GND |
|
2 |
3 or 4 |
GND |
SCK |
13 |
VCC |
5 V |
|
3 |
10 |
3.3 V |
MOSI |
11 |
SDA |
A4 |
|
4 |
8 |
4 |
MISO |
12 |
SCL |
A5 |
|
5 |
9 |
3 |
VCC |
5 V |
|
|
|
6, 7, & 8 |
Others |
Not Used |
GND |
GND |
||
Code:
Prior knowledge of Arduino is recommended, and it may be beneficial to begin with online Arduino examples if you are unfamiliar with them. You can find helpful resources at the Arduino website (https://www.arduino.cc/en/Guide/HomePage). The Arduino board must include the “LiquidCrystal I2C” library packages, which need to be installed in the Arduino sketch editor. It is a one-time setup process.
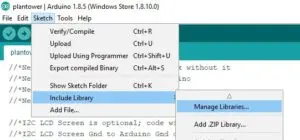
In general, to install arduino packages:
To begin, open the Arduino Sketch Editor. Then follow these steps:
1. Click on “Sketch” in the menu bar.
2. Go to “Include Library” and select “Manage Libraries”.
3. In the search bar that appears, enter the name of the library you need.
4. Click on the desired library package and then click on the “Install” button.
You can access the Arduino script that reads data from the sensor by following this link:
https://drive.google.com/file/d/1N7KHkNi3ASCUrKJLTVSF3G6TRo1y5-8h/view?usp=sharing
This code is also available at the end of this teaching module as an appendix. If you want to view the PM values measured by this script without using the LCD screen, you can upload the script to the Arduino board, open the Arduino Sketch Editor, and click on “Tools” followed by “Serial Monitor” (or use the keyboard shortcut “Ctrl + Shift + M”).
If you wish to plot and view real-time particulate counts on your computer, we have provided a Python script for that purpose. If you haven’t installed Python before, you can refer to our screencast instructions here: https://www.youtube.com/watch?v=qNzeETi2dMM. You can find the Python code at the end of this teaching module as an appendix, or you can access it through this link: [insert link].
Background for Teachers
Air Quality Background:
The World Health Organization has estimated that approximately 3.7 million deaths in 2012 were caused by ambient air pollution. Among the various air pollutants, fine particulate matter (PM2.5), which refers to particles with diameters smaller than 2.5 microns, has the most significant adverse health effects. In northern Utah, elevated levels of PM2.5 are a pressing issue, often surpassing national ambient air quality standards for extended periods, especially during winter. These episodes of poor air quality have severe implications for the health and well-being of the region’s residents, leading to increased cases of asthma, juvenile arthritis, and mortality.
Both government agencies, such as the Utah Division of Air Quality (DAQ), and citizens rely on air quality data from sparsely distributed monitoring stations for planning purposes and public communication. These stations are equipped with expensive, high-quality instruments that meet federal monitoring requirements. However, due to the sparse spatial distribution of these stations, they may not accurately represent the pollutant gradients within a city. In Salt Lake City, variations in elevation, land use, and other factors contribute to daily average PM2.5 concentrations at the neighborhood level that may not be adequately represented by the nearest state monitoring station. Furthermore, the government monitoring stations have limited temporal resolution, with only two stations in Salt Lake County providing hourly PM2.5 levels. This temporal gap is particularly concerning as studies suggest that even short-term increases in pollutant levels can elevate the incidence and severity of asthma and cardiac events.
To address these spatial and temporal gaps in air quality monitoring, networks of low-cost air quality sensors can play a crucial role. These sensors can provide valuable information to air quality managers, healthcare providers, and the community, helping to better understand air quality and minimize exposure risks. However, many low-cost sensors lack independently gathered calibration data, quality assurance procedures, or descriptions of potential inaccuracies in their readings. Presenting unreliable or uncertain information from sensor networks can lead to unnecessary public concern or a false sense of security regarding pollution levels and associated health risks.
The goals of this project include equipping each classroom with a low-cost air quality sensor and involving students in determining how well outdoor air quality measurements represent local conditions within and around their school. Additionally, students will assess the performance of the sensors over time.
Regarding electronics background, a basic understanding of electronics is helpful but not necessary. The primary concern is ensuring that the wires are connected correctly.
The Arduino board, depicted in the figure provided in the Materials section of this module, essentially functions as a miniature computer. It receives data from the air quality sensor, processes it to calculate particulate concentrations, and then presents the data to the user in the form of LCD characters, a file on the SD card, or real-time plotting on a computer.
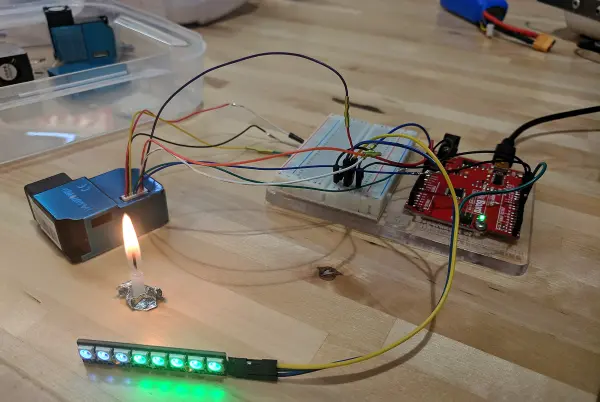
The air quality (AQ) sensor utilizes laser light scattering to measure particulate counts. These sensors work by detecting scattered light. The internal structure of one such sensor is illustrated in the accompanying figure. Although some models may have different air inlet configurations, they all operate by pulling air through a dark chamber containing a light detector and a laser beam.
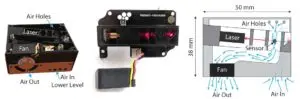
When laser light passes through clean air without particulate pollution, it typically follows a relatively straight path. This means that very little, if any, light would make a sharp 90° turn and reach the sensor. However, when the air contains particulate matter, the light can be reflected off the particles in random directions. This phenomenon can be observed by shining a laser through a cloud of smoke, for example, resulting in a visible line of scattered light traveling through the cloud. In contrast, if the air is clean, the laser beam may pass through the space without any noticeable effects.
A helpful demonstration to introduce this concept in the module could involve using a laser pointer and a fog machine. By directing the laser beam through the fog, the scattered light will become visible, showcasing the impact of particulate matter. Another demonstration option is using a blue laser and comparing its interaction with tonic water (which contains quinine, a substance that scatters light) and regular water. The scattering of light by the quinine in the tonic water can help illustrate the effect of particulate matter on laser light.
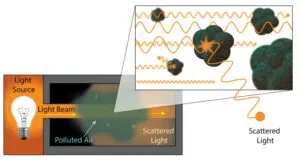
While the scattered light from the laser is random in direction, a portion of it will be scattered towards our sensor and detected. The amount of particulate matter in the air directly influences the likelihood of a light photon reaching the sensor, allowing us to quantify the level of particulate pollution.
LCD Screen: This device is designed specifically for displaying real-time data. It requires a 5V power supply and a ground connection, along with two additional wires to transmit the data to be displayed.
MicroSD Card Reader/Writer: This device also requires power and communication connections with the Arduino. The Arduino will create a file named “PM_Data.csv” on the SD card. This file is in CSV (comma-separated values) format, compatible with programs like Excel and other data analysis tools. If the file already exists, the Arduino will add new data to the existing file, appending it after the previous data. It is advisable to periodically delete the file to prevent the card from filling up. Each time the sensor system restarts, it generates a new random RunID and includes it as the header for each new data set in the CSV file. This approach compensates for the Arduino’s inability to provide actual time or date information (as its clock resets at each restart). The user should match the RunID with a known start time and date.
There are numerous potential research questions that students can explore using the air quality sensor. While students are encouraged to come up with their own creative research questions, here are a couple of examples to get them started:
1. Fireplaces: How does the type of fuel (wood vs. gas) affect particulate pollution levels? How far can the effects of a wood-burning fireplace be detected?
2. Clothes dryers: Can particulate matter be detected in the laundry room when the dryer is on compared to when it is off? Can it be detected near the dryer vent? If a dryer vent is clogged, can a significant amount of particulate matter enter the house?
3. Candles or incense: Are these significant health risks? How do they compare in terms of particulate pollution levels? If a candle is lit in one room, what impact does it have on particulate matter in other rooms?
4. Aerosols (hairspray, cleaners): Do these products generate significant particulates in the room where they are used? Are the particles different from those produced by a fire? (Note: Avoid spraying directly around the sensor to prevent coating the detector, which could affect its performance.)
5. Cleaning/dusting: Is there evidence that performing household chores can pose hazards to health?
6. Cooking: Does the type of food being cooked or the cooking method affect particulate pollution levels?
7. Soldering: What are the risks associated with soldering electronic components? How does ventilation impact particulate pollution levels?
8. Powders: Do activities like playing in a sandbox with materials such as flour or mixing cement generate significant particulate pollution?
9. Industrial sources: What are the particulate concentration levels near a gravel pit, incinerator, power plant, or restaurant? Does the type of restaurant (e.g., wood-fired pizza place vs. sandwich shop) make a difference?
10. Weather effects: How do factors such as wind, rain, and humidity affect readings from sources of particulate pollution?
11. Elevation: If the sensor is taken on a hike during a day with poor air quality, can evidence of the inversion layer be observed, and how quickly does the transition occur? Additionally, sending the sensor up on a tethered weather balloon can provide valuable data, but tracking elevation will require the use of a phone app.
12. Air quality events: What are the effects of fireworks used during local holidays? How does a forest fire occurring a couple of states away impact air quality?
13. Indoor vs. outdoor: What is the relationship between indoor and outdoor air quality? Does it vary based on the season or the age of the home?
14. Motor vehicles: What is the effect of living near a busy street compared to an isolated neighborhood? How far-reaching is the impact of school buses and parental drop-offs and pickups at schools?
These are just a few examples, and there are countless other research questions that can be explored using the air quality sensor.
Code
//*Pins:
 //*Plantower Pin 1 5V to 5V on Arduino
 //*Plantower Pin 2 GND to GND on Arduino
 //*Plantower Pin 3 SET to 3.3V on Arduino (if 0 V it will put the sensor in a low-power standby)
 //*Plantower Pin 4 RX to Digital Pin 4 on Arduino (which will act as the transmitting pin on the Arduino sending data to the sensor's recieving pin 4)
 //*Plantower Pin 5 TX to Digital Pin 3 on Arduino (which will act as the recieving pin on the Arduino taking data from the sensor's transmitting pin 5)
 //*Plantower Pin 6 RESET does not need to be connected, if set to 0V the sensor will reset
 //*Plantower Pin 7 & 8 Not Connected

 //*I2C LCD Screen is optional; code will work without it
 //*I2C LCD Screen Gnd to Arduino Gnd on Arduino
 //*I2C LCD Screen Vcc to 5V on Arduino
 //*I2C LCD Screen SDA to Pin A5 on Arduino
 //*I2C LCD Screen SCL to Pin A4 on Arduino

 //*SD Card Reader is optional; code will work without it
 //*SD Card Reader Gnd to Arduino Gnd on Arduino
 //*SD Card Reader Vcc to 5V on Arduino
 //*SD Card Reader MISO to Pin 12 on Arduino
 //*SD Card Reader MOSI to Pin 11 on Arduino
 //*SD Card Reader SCK (CLOCK) to Pin 13 on Arduino
 //*SD Card Reader CS to Pin 10 on Arduino (may change for different card readers)

 //*The TX pin on the sensor connects to pin 11 on the Arduino
 //
 //*Plantower Reading Portion of Code altered from: Zuyang @ HUST, Date:March.25.2016
 //******************************

#include <SoftwareSerial.h>  //package allowing serial communication
#include <LiquidCrystal_I2C.h> //include LiquidCrystal_I2C library if lc display is attached
#include <SD.h>//needed for sd card reader communication

LiquidCrystal_I2C lcd(0x3F,16,2);  // set the LCD address to 0x27 for a 16 chars and 2 line display, NOTE: Some I2C LCDs will need the address changed from 0x27 to 0x3F

//Define the length of the information beingretrieved from the sensor, this portion must change for different sensor models
//#define LENG 31   //0x42 + 31 bytes equal to 32 bytes, Use for Model 1003, 5003
#define LENG 23   //0x42 + 21 bytes equal to 24 bytes, Use for Model 3003
#define TIME_BETWEEN_READINGS 1000  //number of milliseconds between readings from the sensor (should be more than once a second)

const bool useplotter = false; //true if using arduino's built-in serial plotter, false otherwise. Use false is plotting with python
const int chipSelect = 10;//pin for chip select (CS) on microsd card reader (reader is optional)
unsigned char buf[LENG];  //Contains the information from the sensor

unsigned short PM01=-1;          //variable that will hold the PM1.0 value
unsigned short PM25=-1;         //variable that will hold the define PM2.5 value
unsigned short PM10=-1;         //variable that will hold the define PM10 value
unsigned short PMavg=-1;           //Average of all PM readings
bool useSD=true;       //goes false if there is an SD reader error

unsigned short i=0;  // just a counter
bool gotitright=false; //true if the buffer length was right, to account for different plantower models
String SD_String="";//where the string for the SD card data will be kept
static unsigned long lastReadingTime=0;  //variable to keep track of time (in ms) of last reading
//NOTE if the sensor never connects appropriately, then it will read -1 concentration

// Pin 3 will be the Arduino's RX (recieving pin) connected to the sensor's TX (Plantower Pin 5)
// Pin 4 will be the Arduino's TX (transmitting pin) connected to the sensor's RX (Plantower Pin 4)
SoftwareSerial PMSerial(3, 4);   //initialize the serial connection, 3 & 4 are the digital pin numbers used on the arduino

byte Char2p[8] = {//create a 2 with a point character
 0b01100,  0b10010,  0b00010,  0b00100,  0b01000,  0b10000,  0b11110,  0b00001};
byte Char5[8] = {//create a smaller 5 characer
  0b01111,  0b01000,  0b01000,  0b00110,  0b00001,  0b00001,  0b01110,  0b00000};
byte Char10[8] = {  //create a 10 character
  0b00000,  0b10111,  0b10101,  0b10101,  0b10101,  0b10101,  0b10111,  0b00000};

void setup()
{
  PMSerial.begin(9600);   //Serial communication with the sensor
  PMSerial.setTimeout(1500);    //Time to wait for sensor to respond (should sample each second, at most)
  Serial.begin(9600);  //Serial communication with a possible computer through the USB cable
  while (!Serial) {;} // wait for serial port to connect. Needed for native USB port only

  Serial.println("Starting LCD...");
  lcd.init();                      // initialize the lcd
  lcd.backlight();   //turn on the backlight
  lcd.setCursor(0,0);    //place the cursor
  lcd.print("Starting!..");  //let the user know it's starting
  delay(500);
  Serial.println("LCD Initialized...");

  if (!useplotter) {Serial.println("Initializing card."); }
  if (!SD.begin(chipSelect)) {if (!useplotter) {Serial.println("Card failed, or not present"); lcd.setCursor(0,0); lcd.print("Card NOT found.");}}//start talking to the SD card reader
  else {if (!useplotter) {Serial.println("Card initialized."); lcd.setCursor(0,0); lcd.print("Card detected.");}}

  File dataFile = SD.open("PM_Data.csv", FILE_WRITE); //Open a file named PM_Data.csv
  randomSeed(analogRead(0)+dataFile.size());//seed the random number generator with something a bit random...
  if (!useplotter) {Serial.print("File Size: ");Serial.println(dataFile.size());}
  SD_String="RunID: "+String(random(0,10))+String(random(0,10))+String(random(0,10))+String(random(0,10));
  if (!useplotter) {Serial.print("Run ID: ");Serial.println(SD_String);}

  lcd.setCursor(0,1);    //place the cursor
  lcd.print(SD_String);
  lcd.createChar(0, Char2p); // Sends the custom char to lcd
  lcd.createChar(1, Char5); // Sends the custom char to lcd
  lcd.createChar(2, Char10); // Sends the custom char to lcd

  if (dataFile) { //if the file opened correctly (SD reader attached)
    dataFile.println(SD_String);//print RunID in the file
    SD_String="t(s),PM1.0 (ug/m3),PM2.5 (ug/m3),PM10 (ug/m3)";   //header for csv file to be created on SD card
    dataFile.println(SD_String);//print the header in the file
    dataFile.close();//close the file
  }
  else {
    Serial.println("Error opening data file on SD card"); //alert user to error
    useSD=false;//stop trying to use the SD reader
  }
  delay(4000);//pause so user can get session ID
  if (!useplotter) {Serial.print("t(s)\t");Serial.print("PM1.0\t");Serial.print("PM2.5\t");Serial.print("PM10\t");Serial.println("PMavg");} //alert user to error
}

void loop()  //This is what the Arduino will do over and over, while it has power
{
  String SD_String = "";//data to be written to SD card
  if(PMSerial.find(0x42)){    //check if there is a serial connection to the sensor
    PMSerial.readBytes(buf,LENG);  //read the information from the sensor and put it in the variable buf
    if(buf[0] == 0x4d){  //first read value
      if(checkValue(buf,LENG)){//check if some data of some length was recieved from the sensor
        PM01=transmitPM01(buf); //count PM1.0 value of the air detector module
        PM25=transmitPM2_5(buf);//count PM2.5 value of the air detector module
        PM10=transmitPM10(buf); //count PM10 value of the air detector module
        PMavg=(PM01+PM25+PM10)/3; //find the average PM count
      }
    }
  }

  if (millis() - lastReadingTime >=TIME_BETWEEN_READINGS)   //Take a reading every TIME_BETWEEN_READINGS
    {
      if (useSD){ //SD reader still good
        SD_String = String(int(round(lastReadingTime/1000)))+","+String(PM01)+","+String(PM25)+","+String(PM10)+","; //data: time and the PM values
        File dataFile = SD.open("PM_Data.csv", FILE_WRITE); //open the file
        if (dataFile) {  //if it opened correctly...
          dataFile.println(SD_String);  //write the data to the file
          dataFile.close();   //close the file
        }
        else {
          Serial.println("Error opening data file on SD card"); //alert to possible error
        }
      }

      lastReadingTime = millis(); //update time of last reading

      if (!useplotter){Serial.print(int(round(lastReadingTime/1000)));Serial.print("\t");}
      Serial.print(PM01);Serial.print("\t");
      Serial.print(PM25);Serial.print("\t");
      Serial.print(PM10);Serial.print("\t");
      Serial.print(PMavg);Serial.println("");

      lcd.clear();   //clear the lcd
      lcd.setCursor(0,0);        //print to the lcd
      lcd.print(" t: "); //time
      lcd.print(int(round(lastReadingTime/1000)));

      lcd.setCursor(8,0);        //PM1.0
      lcd.print(" 1: ");
      lcd.print(PM01);

      lcd.setCursor(0,1);        //PM2.5
      lcd.print((char)0);  // 2. character
      lcd.print((char)1);  // 5 character
      lcd.print(": ");
      lcd.print(PM25);

      lcd.setCursor(9,1);
      lcd.print((char)2);  //10 character
      lcd.print(": ");
      lcd.print(PM10);
    }

}
char checkValue(unsigned char *thebuf, char leng)
{
  char receiveflag=0;
  int receiveSum=0;

  for(int i=0; i<(leng-2); i++){
    receiveSum=receiveSum+thebuf[i];
  }
  receiveSum=receiveSum + 0x42;

  if(receiveSum == ((thebuf[leng-2]<<8)+thebuf[leng-1]))  //check the serial data
  {
    receiveSum = 0;
    receiveflag = 1;
  }
  return receiveflag;
}

int transmitPM01(unsigned char *thebuf)
{
  int PM01Val;
  PM01Val=((thebuf[3]<<8) + thebuf[4]); //count PM1.0 value of the air detector module
  return PM01Val;
}

//transmit PM Value to PC
int transmitPM2_5(unsigned char *thebuf)
{
  int PM2_5Val;
  PM2_5Val=((thebuf[5]<<8) + thebuf[6]);//count PM2.5 value of the air detector module
  return PM2_5Val;
  }

//transmit PM Value to PC
int transmitPM10(unsigned char *thebuf)
{
  int PM10Val;
  PM10Val=((thebuf[7]<<8) + thebuf[8]); //count PM10 value of the air detector module
  return PM10Val;
}
Python
# -*- coding: utf-8 -*-

“””

Code to be used with an Arduino and Plantower sensor to measure air quality

Arduino must have proper read code installed

Written by Anthony (Tony) Butterfield, Department of Chemical Engineering

University of Utah

“””

import serial #Import Serial Library

import numpy as np

import matplotlib.pyplot as plt  #plot library to show our data

import matplotlib.patches as patches

import time

import csv #import the comma separated package

arduinoSerialData = serial.Serial(‘com16’,9600) #Create Serial port object called arduinoSerialData

AQnum=[] #vector of PM numbers

AQcat=[] #list of categories

t = [0] # the time vector

icat=0 #the index of data categories

keepchecking4newcats=True #see if it’s the first time cathering categories of PM data

plt.close(“all”)  #close all open plots

fig, ax = plt.subplots()  #open a new figure in which we will plot

ax.grid() #display a grid on the plot

plt.ion() #starts interactive plot mode, so we can have an animated plot

ax.set_xlim(0, 100)#initial x limits

ax.set_ylim(0, 100)#initial y limits

plt.xlabel(‘time (sec)’, fontsize=14)#x axis label with size 14 font

plt.ylabel(‘PM (‘+’$\mu$g’+’/$m^3$’+’)’, fontsize=14)#y-axis label with size 14 font

ax.tick_params(labelsize=14)#ticks on axis set to size 14 font

fig.canvas.draw()#draw the plot canvas

plt.show(block=False) #keeps the plot from tying up the command window

print(‘Starting…’) #forster healthy communication with your user

ymax=-float(“inf”)#min and max y axis for plot

ymin=float(“inf”)

lines=[] #where we’ll keep our lines for our plots

ymin=float(“inf”)#min and max for plot axis

ymax=-float(“inf”)

RectWidth=100 #width of rectangle for AQ index colors, should be big…

AQclrs=np.array([[0,1,0,.2],[1,1,0,.2],[1,.5,0,.3],[1,0,0,.3],[.7,0,1,.3],[.7,0,.5,.2],[.4,0,.2,.3]]) #green,yellow,orange,red,purple,maroon

AQlvls=[0,50,100,150,200,300,500,10000] #AQ index levels

LnClr=[[0,1,1,.8],[0,.8,.8,.8],[0,.5,.5,.8],[0.3,0.3,0.3,.8]]  #line colors

i=0

PMrange=[]  #the rectangles that show the AQ index colors

for clr in AQclrs:#add color ranges for AQ index

    rec=ax.add_patch( patches.Rectangle( (0, AQlvls[i]), RectWidth, AQlvls[i+1]-AQlvls[i], fc=AQclrs[i,:] )  )

    PMrange.append(rec)

    i+=1


tic = time.time() # get the starting time

toc = 0 #will contain the time since initial tic

AQData=np.zeros([5,]) #initialize the array of data

while (1==1):#loop until the user hit ctrl-c

    toc = time.time() – tic;  #measure the time

    try:#collect data until ctrl-c is used

        if (arduinoSerialData.inWaiting()>0): #board is ready to send info

            AQDataTxt = str(arduinoSerialData.readline()) #get the info from the board

            i1=AQDataTxt.index(‘\”) #find the first singl quote

            i2=AQDataTxt.index(‘\”,i1+1) #find the last singl quote

            AQDataTxt=AQDataTxt[i1+1:i2] #extract the string between the single quotes

            AQDataTxt=AQDataTxt.replace(‘\\r\\n’,”)#remove the return

            AQDataTxt=AQDataTxt.replace(‘\\x00’,”)#remove the NULL chars

            #print(AQDataTxt)

            AQDataSplit=AQDataTxt.split(‘\\t’) #split by the tab character

            if (len(AQDataSplit)==1): #no tabs, just print for user

                isdata=False #true only if it’s numerical data

                print(AQDataTxt)

            else:  #has tab, then it’s part of a data table

                try:  #see if it’s a string that would be an integer

                    int(AQDataTxt[0]) #it can be made into an integer

                    isdata=True  #then it is data

                except ValueError:  #if not then it’s the column header

                    isdata=False

                    AQcat=AQDataSplit

                    icat=0 #counter for categories

                    for cat in AQcat:

                        print(‘{0:^10}’.format(cat),end=”)  #print the headers

                        if (icat>0): #avoid the time column when creating lines

                            li, = ax.plot([0], [0], color=LnClr[icat-1]) #defines a line, li and makes clear we’ll be adding to it with the comma

                            lines.append(li) #add a line to a vector of lines

                        icat+=1 #incriment counter for categories

                    print(”)  #create a newline

                    ax.legend(AQcat[1:-1]) #give a legend to the plot

                    ncat=len(AQcat) #number of categories

                    AQData=np.zeros([ncat,]) #initialize the array of data


            if (isdata):

                AQnums=[int(elem) for elem in AQDataSplit] #conver string numbers to integers

                for num in AQnums: #loop through the numbers

                    print(‘{0:^10d}’.format(num),end=”)

                AQData=np.vstack([AQData,AQnums])

                print(”)  #a newline

                i=0

                if (max(AQnums)>ymax):

                    ymax=max(AQnums)

                if (min(AQnums)<ymin):

                    ymin=min(AQnums)

                for line in lines:

                    if (i>0):

                        line.set_xdata(AQData[:,0]) #plot the new x data for this line

                        line.set_ydata(AQData[:,i]) #plot the new y data for this line

                    i+=1

                plt.xlim( [0, toc] ) #adjust x-axis limit

                i=0

                for clr in AQclrs:  #change the width of AQ color squares

                    PMrange[i].set_width(toc)

                    i+=1

                plt.ylim( [0, ymax] ) #adjust y-axis limit

                plt.draw() #draw the new plot

                plt.pause(0.1) #pause a bit so the plot can show

    except KeyboardInterrupt: #let us escape when we’re done, when ctrl-c pressed

        print(‘broke’)

        break #exit the while loop

arduinoSerialData.close()  #stop tying up the serial port

# SAVE THE DATA

f = open(‘PMdata.csv’, ‘wt’, newline=”)#open a file (this will overwrite every time)

writer = csv.writer(f)

writer.writerow( AQcat ) #write the header

for dataRow in AQData:

    writer.writerow( dataRow.tolist()) #write the data

f.close()- What Arduino boards are compatible with this project?
The project uses an Arduino Uno or equivalent boards such as SparkFun RedBoards, which perform equally well. - Can the sensor be powered without a computer?
Yes, the board can be powered using a USB phone charger, external battery, or a 9V battery with an adapter. - Which Plantower sensor models work with the provided code?
The code is compatible with Plantower models 1003, 3003, 5003, and 7003; LENG must be adjusted in the code per model. - Do I need an LCD screen and SD card reader for the code to work?
No, both the I2C LCD screen and microSD card reader are optional; the code will work without them. - How does the Arduino record time for readings?
The Arduino records elapsed time since power-up (t = 0) and generates a RunID; users must match RunID to the real start time. - What file format does the Arduino write to the SD card?
The Arduino writes data to a file named PM_Data.csv in CSV (comma-separated values) format. - What libraries are required in the Arduino IDE?
The LiquidCrystal I2C library and the SD library must be installed in the Arduino Sketch Editor. - Can I visualize real-time particulate data on a computer?
Yes, you can use the Arduino serial monitor or the provided Python script to create real-time plots. - What power and signal connections are needed for the I2C LCD?
The I2C LCD needs 5V and GND for power and SDA to A4 and SCL to A5 on the Arduino. - How are the Plantower sensor TX and RX pins wired to the Arduino?
Plantower TX connects to Arduino digital pin 3 (Arduino RX) and Plantower RX connects to Arduino digital pin 4 (Arduino TX) using SoftwareSerial.