Summary of Spectrum Analyzer, Arduino project with FFT algorithm
This project describes creating a color organ/spectrum analyzer using an Arduino Uno that performs FFT processing entirely on the board to visualize sound frequencies through RGB LEDs. The FFT breaks down audio input into 32 frequency bins, grouped into ranges controlling red, green, and blue LEDs. A bar graph LED display driven by ULN2003 with a 12V supply is chosen over PWM for better brightness response. Sound input is provided by a MK136 microphone and amplifier kit with NE5532 IC, powered from Arduino’s 5V. Data can also be sent over serial for external PC applications.
Parts used in the Color Organ / Spectrum Analyzer Project:
- Arduino Uno board
- ULN2003 Darlington transistor array
- 12 LEDs (4 red, 4 green, 4 blue)
- 12 resistors (for LEDs)
- MK136 microphone and amplifier kit
- Operational amplifier IC NE5532 (part of MK136 kit)
- 12V power supply (for LEDs)
The basic idea was to create color organ / spectrum analyzer on arduino board, trying to minimize quantity of external components, like analog filters, LED display drivers, etc.
Spend a lot of time in search on internet I was able to find only two ! project , which implemented FFT in order to solve a problem. One of them is:
http://elm-chan.org/works/akilcd/report_e.html
in a few days it will celebrate 6-th anniversary. The obstacle, at least for me, was to compile / adapt his software for Arduino IDE platform, as it written in assembly and C. So, I’ve moved on, and was lucky to discover an excellent chunk of code dated back to 1989! They didn’t have floating point co-processor or “blue deep” around at that time, so mathematical skills were in high demand.
FFT algorithm could find application in wide variety of projects, for example, musical note recognition, voice recognition, sound localization etc. It could be done in Arduino, or in combination with PC. In this project all functionality implemented in Arduino. Sampling, FFT processing and visualization of music, everything done by single arduino Uno board alone!. The same time, after each stage data could be extracted via serial link to PC. To use the the data provided by Arduino in different application on PC (like interactivity / processing), you can just pull data over serial link, as it was done for debugging purposes with “f” command. After FFT-processing input data array x, generated output array fx with 32 elements, “bins”, each representing a range of frequencies. The width of a bin equals: D = 1 / T, where T is input array sampling timing, in our case T = 14.6 millisecond.
D = 1 / (14.6 * 10^-3) = ~ 70 Hz.
So, the value of fx[0] is amplitude DC offset up to 35 Hz;
fx[1] is amplitude in a range 35 <—> 105 Hz;
fx[2] is amplitude in a range 105 <—> 175 Hz;
fx[3] is amplitude in a range 175 <—> 245 Hz;
fx[4] is amplitude in a range 245 <—> 315 Hz;
………………………………………………………..
fx[31] is amplitude in a range 2135 <—> 2170 Hz;
Upper limits could be extended up to 76 kHz.(*)
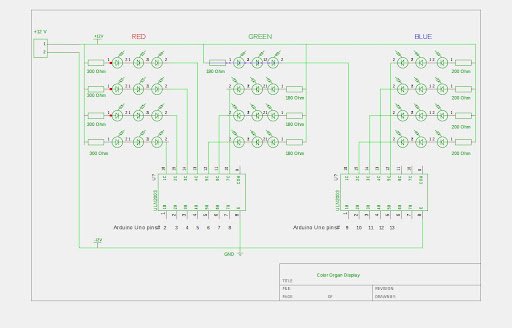
Sum up first 10 fx bins, I’m getting 35 <—> 735 Hz frequency range for red LED’s, from 11-th to 20-th consequently provides me 735 <—> 1435 Hz for green LED’s, and from 21-st to 31-st 1435 <—> 2170 Hz range for blue LED’s.
Now hardware part.
I was considering two way to build display, using PWM or BarGraph. In my opinion, PWM is not quite suited with LED, due nonlinearity in their current-brightness response. Probably, PWM approach would be O’K with incandescent lights.
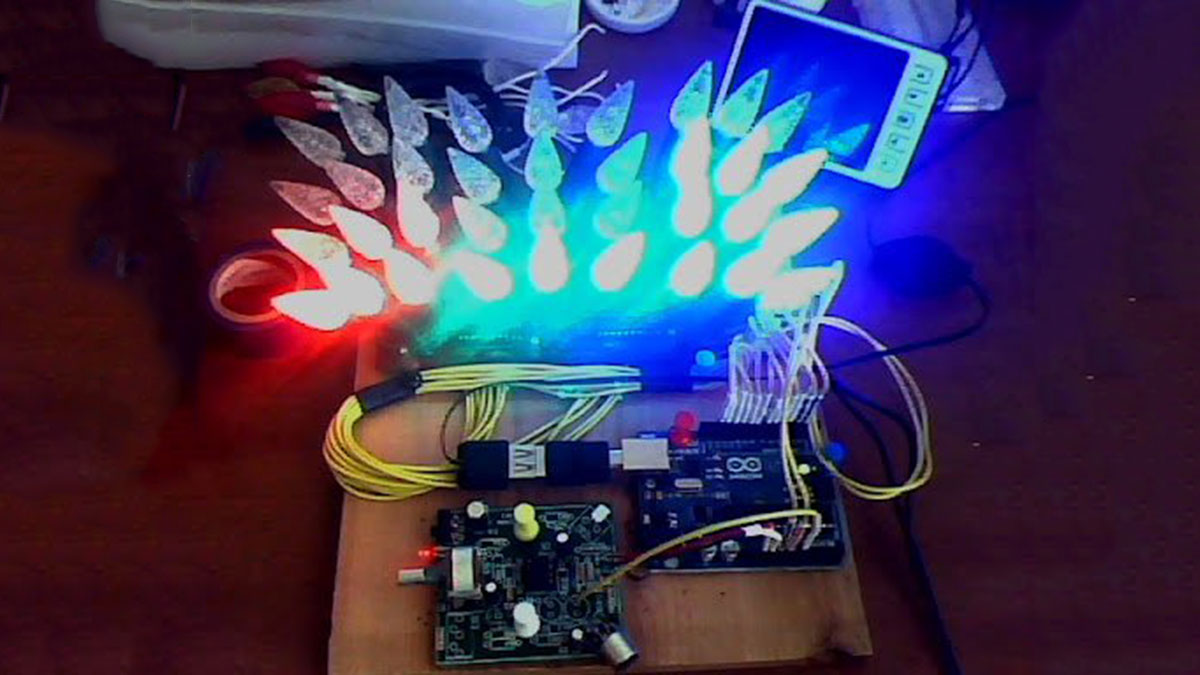
BarGraph design gives better impression, when higher sound volume highlighted bigger area. Just imagine, how beautiful Fireworks are!
I’ve used Christmas LEDs, that left over since last holiday ![]() This is why I put 3 of them in each string, and have to use ULN2003 with 12V power source. Basically, all you need is 12 Leds ( 4 – red, 4 – green and 4 blue ) and 12 resistors, connect led+resistor between output of arduino board and ground.
This is why I put 3 of them in each string, and have to use ULN2003 with 12V power source. Basically, all you need is 12 Leds ( 4 – red, 4 – green and 4 blue ) and 12 resistors, connect led+resistor between output of arduino board and ground.
For sound input I used a kit MK136 ( 2 mic’s + amplifier IC NE5532 ), powered up from arduino board +5V. Why kit? It provides a board and components. Next, you can easily reconfigure input circuitry for different sound sources as:
For more detail: Spectrum Analyzer, Arduino project with FFT algorithm