Summary of Using Temperature, Rainwater, and Vibration Sensors on an Arduino to Protect Railways
Summary: This project demonstrates a small-scale Arduino system using temperature, rainwater, and vibration sensors with MATLAB to detect track hazards. Sensor readings drive LEDs and a buzzer and log data, showing how such monitoring could improve railway safety.
Parts used in the Using Temperature, Rainwater, and Vibration Sensors on an Arduino to Protect Railways:
- A computer with the latest version of MATLAB installed
- Arduino Board
- Temperature Sensor
- Rainwater Sensor
- Vibration Sensor
- Red LED Light
- Blue LED Light
- Green LED Light
- RBG LED Light
- Buzzer
- 18 Male-Male Wires
- 3 Female-Male Wires
- 2 Female-Female Wires
- 6 330 ohm resistors
- 1 100 ohm resistor
In modern-day society, an increase in rail passengers means that rail companies must do more to optimize networks to keep up with the demand. In this project we will show on a small scale how temperature, rainwater, and vibration sensors on an arduino board can potentially help increase the safety of passengers.
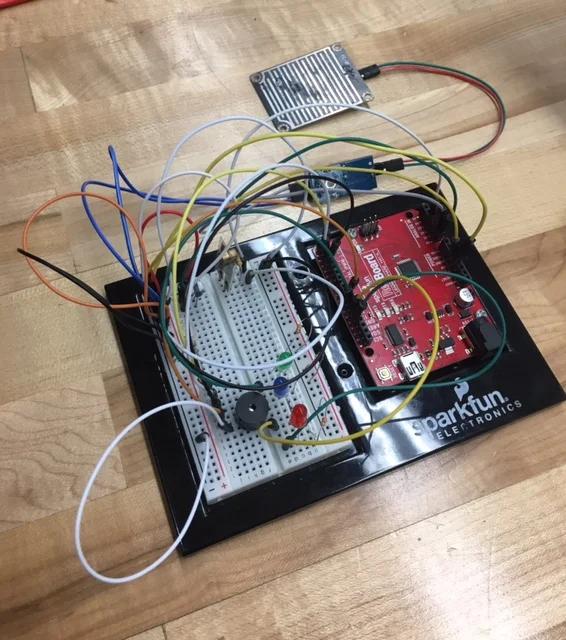
This Instructable will step-by-step show the wiring for the temperature, rainwater, and vibration sensors on the arduino as well as show the MATLAB code required to run these sensors.
Step 1: Parts and Materials
1. A computer with the latest version of MATLAB installed
2. Arduino Board
10. Buzzer
11. 18 Male-Male Wires
12. 3 Female-Male Wires
13. 2 Female-Female Wires
14. 6 330 ohm resistors
15. 1 100 ohm resistor
Step 2: Temperature Sensor Wiring
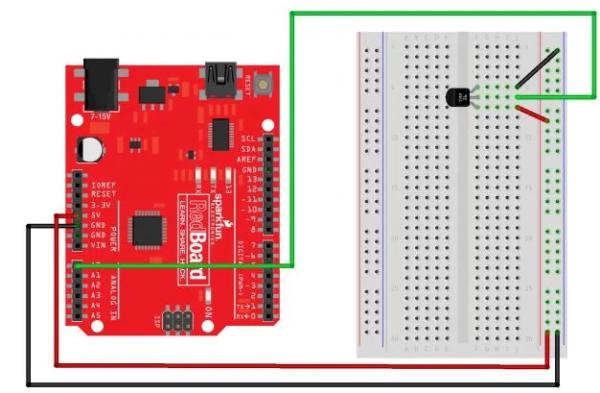
Above is the wiring and MATLAB code for the temperature sensor input as well.
The wires from ground and 5V only need to be ran to the negative and positive respectively once for the entire board. From here on out, any ground connections will come from the negative column and any 5V connections will come from the positive column.
The code below can be copy and pasted for the temperature sensor.
%% TEMPERATURE SENSOR
% For the temperature sensor we used the following source along with
% EF230 website material to modify our temperature sensor to allow user
% input and 3 LED light outputs with a graph.
%This sketch was written by SparkFun Electronics,
%with lots of help from the Arduino community.
%Adapted to MATLAB by Eric Davishahl.
%Visit http://learn.sparkfun.com/products/2 for SIK information.
clear all, clc
tempPin = ‘A0’; % Declaring the analog pin connected to the temp sensor
a=arduino(‘/dev/tty.usbserial-DA017PNO’,’uno’);
% Define anonymous function that converts the voltage to temperature
tempCfromVolts = @(volts) (volts-0.5)*100;
samplingDuration = 30;
samplingInterval = 2; % Seconds between temperature readings
%set up vector of sampling times
samplingTimes = 0:samplingInterval:samplingDuration;
%calculate the number of samples based on the duration and interval
numSamples = length(samplingTimes);
%preallocate temp variables and variable for the number of readings it will store
tempC = zeros(numSamples,1);
tempF = tempC;
% using input dialog box to store max and min rail temperatures
dlg_prompts = {‘Enter Max Temp’,’Enter Min Temp’};
dlg_title = ‘Rail Temperature intervals’;
N=22;
dlg_ans = inputdlg(dlg_prompts,dlg_title,[1, length(dlg_title)+N]);
% Storing the inputs from user and displaying that the input was recorded
max_temp = str2double(dlg_ans{1})
min_temp = str2double(dlg_ans{2})
txt = sprintf(‘Your input has been recorded’);
h=msgbox(txt);
waitfor(h);
% For loop to read the temperatures a specific number of times.
for index = 1:numSamples
% Read the voltage at tempPin and store as variable volts
volts = readVoltage(a,tempPin);
tempC(index) = tempCfromVolts(volts);
tempF(index) = tempC(index)*9/5+32; % Convert from Celsius to Fahrenheit
% If statements to make specific LED lights blink depending on which condition is met
if tempF(index) >= max_temp % Red LED
writeDigitalPin(a, ‘D13’, 0);
pause(0.5);
writeDigitalPin(a, ‘D13’, 1);
pause(0.5);
writeDigitalPin(a, ‘D13’, 0);
elseif tempF(index) >= min_temp && tempF(index) < max_temp % Green LED
writeDigitalPin(a, ‘D11’, 0);
pause(0.5);
writeDigitalPin(a, ‘D11’, 1);
pause(0.5);
writeDigitalPin(a, ‘D11’, 0);
elseif tempF(index) <= min_temp % Blue LED
writeDigitalPin(a, ‘D12’, 0);
pause(0.5);
writeDigitalPin(a, ‘D12’, 1);
pause(0.5);
writeDigitalPin(a, ‘D12’, 0);
end
% Display the temperatures as they are measured
fprintf(‘Temperature at %d seconds is %5.2f C or %5.2f F.\n’,…
samplingTimes(index),tempC(index),tempF(index));
pause(samplingInterval) %delay until next sample
end
% Plotting the temperature readings
figure(1)
plot(samplingTimes, tempF,’r-*’)
xlabel(‘Time (Seconds)’)
ylabel(‘Temperature (F)’)
title(‘Temperature Readings from the RedBoard’)
Step 3: Temperature Sensor Output
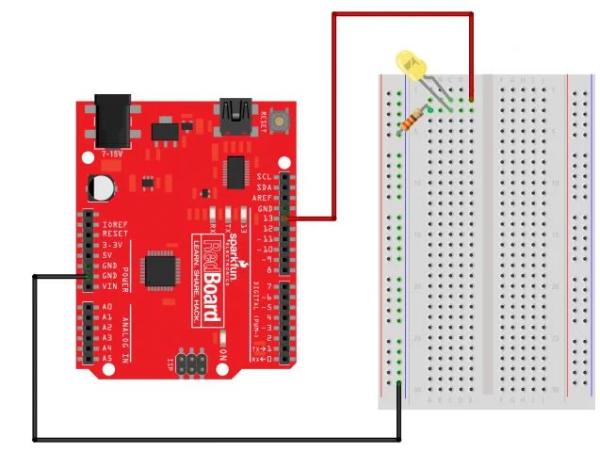
Above is the wiring and MATLAB code for the temperature sensor output.
For this project we used three LED lights for the output of our temperature sensor. We used a red for if the tracks were too hot, a blue if they were too cold, and a green if they were in between.
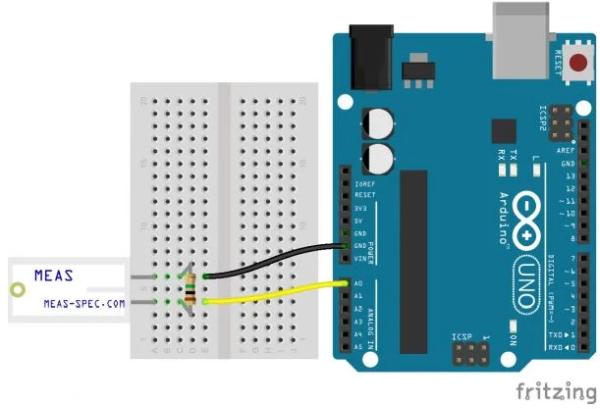
Step 4: Rainwater Sensor Input
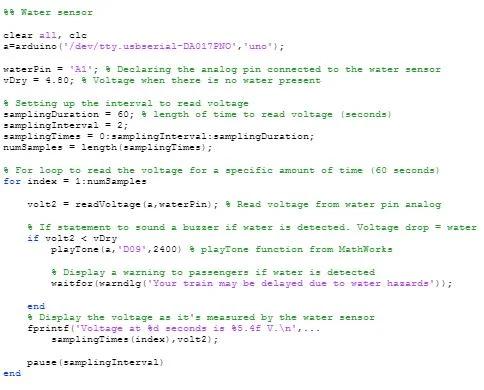
Above is the wiring for the rain water sensor and the MATLAB code is posted below.
%% Water sensor
clear all, clc
a=arduino(‘/dev/tty.usbserial-DA017PNO’,’uno’);
waterPin = ‘A1’;
vDry = 4.80; % Voltage when there is no water present
samplingDuration = 60;
samplingInterval = 2;
samplingTimes = 0:samplingInterval:samplingDuration;
numSamples = length(samplingTimes);
% For loop to read the voltage for a specific amount of time (60 seconds)
for index = 1:numSamples
volt2 = readVoltage(a,waterPin); % Read voltage from water pin analog
% If statement to sound a buzzer if water is detected. Voltage drop = water
if volt2 < vDry
playTone(a,’D09′,2400) % playTone function from MathWorks
% Display a warning to passengers if water is detected
waitfor(warndlg(‘Your train may be delayed due to water hazards’));
end
% Display the voltage as it’s measured by the water sensor
fprintf(‘Voltage at %d seconds is %5.4f V.\n’,…
samplingTimes(index),volt2);
pause(samplingInterval)
end
Step 5: Rainwater Sensor Output
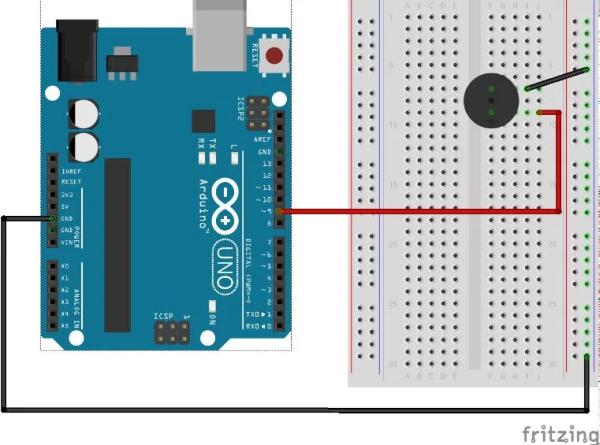
Above is the wiring for a buzzer that beeps whenever too much water falls on the track. The code for the buzzer is embedded within the code for the rainwater input.
Step 6: Vibration Sensor Input
Above is the wiring for the vibration sensor. Vibration sensors can be important for railway systems in the case of falling rocks on a track. The MATLAB code is posted below.
%% Vibration Sensor
clear all, clc
PIEZO_PIN = ‘A3’; % Declaring the analog pin connected to the vibration sensor a=arduino(‘/dev/tty.usbserial-DA017PNO’,’uno’); % Initializing the time and interval to measure vibration samplingDuration = 30; % Seconds samplingInterval = 1;
samplingTimes = 0:samplingInterval:samplingDuration;
numSamples = length(samplingTimes);
% Using the code from the following source we modified it to turn on a
% purple LED if vibration is detected.
% SparkFun Tinker Kit, RGB LED, written by SparkFun Electronics,
% with lots of help from the Arduino community
% Adapted to MATLAB by Eric Davishahl
% Initializing the RGB pin
RED_PIN = ‘D5’;
GREEN_PIN = ‘D6’;
BLUE_PIN = ‘D7’;
% For loop to record voltage changes from the vibration sensor over a
% specific time interval (30 seconds)
for index = 1:numSamples
volt3 = readVoltage(a,PIEZO_PIN);
% If statement to turn a purple LED on if vibration is detected
if volt3>0.025
writeDigitalPin(a,RED_PIN,1);
% Creating a purple light
writeDigitalPin(a,GREEN_PIN,0);
writeDigitalPin(a,BLUE_PIN,1);
else % Turn off LED if no vibration is detected.
writeDigitalPin(a,RED_PIN,0);
writeDigitalPin(a,GREEN_PIN,0);
writeDigitalPin(a,BLUE_PIN,0);
end
% Display the voltage as it is measured.
fprintf(‘Voltage at %d seconds is %5.4f V.\n’,…
samplingTimes(index),volt3);
pause(samplingInterval)
end
% Cut off light when measuring vibrations is done
writeDigitalPin(a,RED_PIN,0);
writeDigitalPin(a,GREEN_PIN,0);
writeDigitalPin(a,BLUE_PIN,0);
Step 7: Vibration Sensor Output
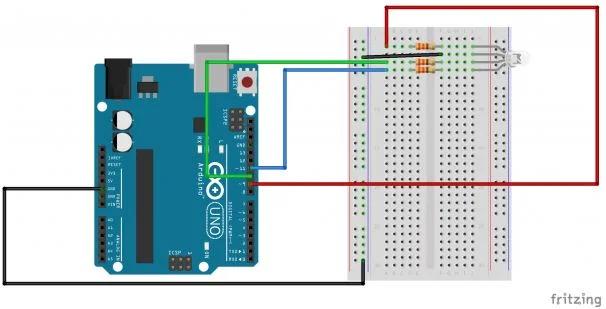
Above is the wiring for the RBG LED light used. The light will glow purple when vibrations are detected. The MATLAB code for the output is embedded within the code for the input.
Step 8: Conclusion
After following all of these steps you should now have an arduino with the ability to detect temperature, rainwater, and vibrations. While viewing how these sensors work on a small scale, it is easy to imagine how vital they could be to railway systems in modern life!
Source: Using Temperature, Rainwater, and Vibration Sensors on an Arduino to Protect Railways
- What does the temperature sensor do in the project?
It reads analog voltage on A0, converts volts to temperature, displays readings, blinks different LEDs based on user-set max and min temperatures, and plots temperature over time. - How are max and min temperature thresholds provided?
They are entered by the user via an input dialog box and stored as max_temp and min_temp in the MATLAB code. - Which pins control the temperature indicator LEDs?
The code uses digital pins D13 for red, D11 for green, and D12 for blue LEDs. - How does the rainwater sensor trigger an alert?
The water sensor reads voltage on A1 and if the measured voltage is less than vDry it plays a tone on D09 and displays a warning dialog. - What does the vibration sensor output do when vibration is detected?
When voltage on A3 exceeds 0.025 V the code turns on the RGB LED pins to create a purple light indicating vibration. - Which pins are used for the RGB LED in the vibration circuit?
The RGB LED uses pins D5 for red, D6 for green, and D7 for blue. - How long do the sampling routines typically run?
Examples in the project use samplingDuration values of 30 seconds for temperature and vibration and 60 seconds for the water sensor, with specified samplingInterval values. - Where are ground and 5V connections handled on the board?
Ground and 5V are run to negative and positive columns once for the entire board; subsequent connections use those columns for ground and 5V. - Does the project include plotting of sensor data?
Yes, the temperature code plots temperature (F) versus time; other sensors print voltage readings to the console and show dialogs or play tones when thresholds are met.