
Summary of Segger Arduino debugger helps your development workflow
The Segger Arduino debugger, via the Ozone tool, enhances embedded development by offering advanced debugging, profiling, and performance analysis for Portenta boards. It supports various CPUs, provides high-speed flash loading, and integrates seamlessly with major IDEs using specific adapters for connection.
Parts used in the Segger Arduino Debugger Project:
- Ozone graphical debugger software
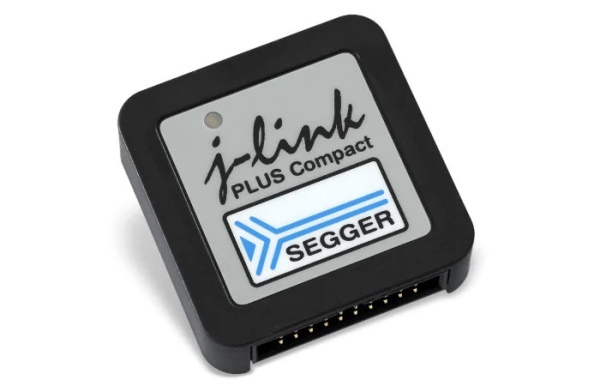
- J-Link debug probes
- Segger 50-Mil 10-Pin Patch Adapter
- J-Link 19-pin Cortex-M Adapter
- Arduino Portenta boards
- C/C++ source code or assembly level code
- Flash memory chips
- SPI flashes
Arduino developers, students and enthusiasts may be interested in the Segger Arduino debugger, “Debuggers are the scalpel that allows a developer to dissect any application code running on embedded hardware. “Arduino has partnered with Segger to help support developers in creating their own embedded systems, implementing compatibility of Segger debugging solutions with Portenta boards.
“Ozone is Segger’s full-featured graphical debugger for embedded systems. Thanks to features such as trace, code profiling and code coverage analysis, it’s also an extremely powerful performance analyzer. Ozone supports the debugging of any embedded application on C/C++ source and assembly level. It can load applications built with any toolchain/IDE and even debug the target’s resident application without any source. Ozone includes all well-known debug controls and information windows, while making use of the best performance of J-Link debug probes. The user interface is highly intuitive, yet fully configurable. Each window can be moved, re-sized and docked to fit every developer’s needs”
Features of the Segger Arduino debugger include:
– Record-breaking flashloaders, up to 3MB/s RAM download speed.
– Unlimited Flash Breakpoints feature allows the user to set an unlimited number of breakpoints when debugging in flash memory.
– Wide range of CPUs and architectures supported; in fact, everything from single 8051 to mass market Cortex-M to high-end cores like Cortex-A (32- & 64-bit).
– Direct interface with SPI flashes, without the need of a CPU between J-Link and the SPI flash.
Supported by major IDEs.
“To connect the Portenta boards with J-Link debuggers, there are two adapters available: Segger’s 50-Mil 10-Pin Patch Adapter and J-Link 19-pin Cortex-M Adapter. The 50-Mil 10-Pin Patch Adapter converts the standard 20 pin 0.1″ connector to the standard 10-pin 0.05″ Cortex-M connector. This allows custom connections/wiring between the 20-pin and 10-pin side.”
For more information on the Segger Arduino debugger and connecting it to your Arduino development boards jump over to the official Arduino blog by following the link below.
Source: Segger Arduino debugger helps your development workflow
-
What is the primary function of Ozone?
Ozone is a full-featured graphical debugger for embedded systems that also serves as a powerful performance analyzer. -
How fast is the RAM download speed?
The system features record-breaking flashloaders with up to 3MB/s RAM download speed. -
Can I set unlimited breakpoints in flash memory?
Yes, the Unlimited Flash Breakpoints feature allows users to set an unlimited number of breakpoints when debugging in flash memory. -
Which CPU architectures are supported?
It supports a wide range including single 8051, mass market Cortex-M, and high-end cores like Cortex-A (32- & 64-bit). -
Do I need a CPU between the J-Link and SPI flash?
No, there is a direct interface with SPI flashes without the need of a CPU between the J-Link and the SPI flash. -
What adapters connect Portenta boards with J-Link debuggers?
The two available adapters are the Segger 50-Mil 10-Pin Patch Adapter and the J-Link 19-pin Cortex-M Adapter. -
Does the user interface allow customization?
Yes, the interface is highly intuitive yet fully configurable, allowing each window to be moved, re-sized, and docked. -
Can Ozone debug applications built with any toolchain?
Yes, it can load applications built with any toolchain or IDE and even debug the target's resident application without any source.
