Millions of farmers in the world each year face loss of their crop. Its mainly due to crop disease or environmental problems like nature of soil (pH), poor quality of air, and excessive or very low moisture in soil.
To get cure from these problems, farmers need to know the fertilizer according to the condition of the soil and also the amount of water needed everyday for his crop with respect to the temperature, moisture and humidity.
More than 50% of the people’s occupation in the world is farming and we need a innovative solution, which is affordable and can be implemented in the current scenario.
What will be end final product?
The idea is to make a hardware + mobile app which could be used by farmers, can update farmers with any issues with their farms and can analyse amount of sunlight, rain, soil moisture, pH and can suggest best fertilizers according to the data from the sensors. It can also compare the data with the local weather data for that GPS location. The app will also have real-time updated selling prices of crops for the farmer.
Step 1: What Do You Need?
Boards & Parts:
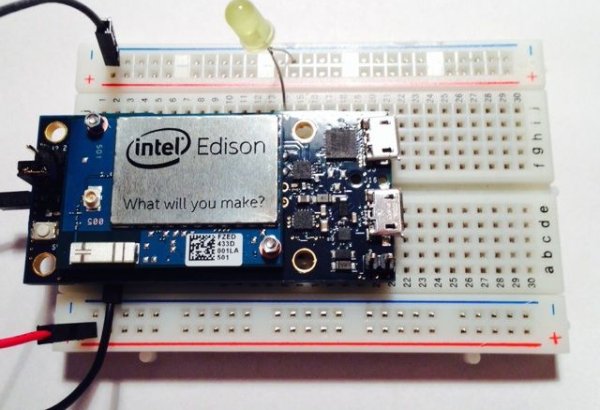
1) Intel Edision
2) Grove base shield
3) An empty bottle
4) Some jumpers
5) A battery for powering your board
Sensors:
1) Grove soil moisture sensor
2) Grove temperature & humidity sensor
3) Grove air quality sensor
4) Grove dust sensor
Tools:
1) Cutter/Dremel
2) Some tape to sticking up things
Web Services:
1) Ubidots.com account
Step 2: Step 1: Cut the Bottle
Start by cutting the bottle. Cut the bottle in 3 parts, one from the top, one from the funnel just like the image above.
Cut it neatly as we will need it afterwards.
Step 3: Step 2: Setting Up the Web Service
1) Go to Ubidots.com and then sign up
2) Log into you dashboard
3) Click on the sources button
4) Click on add source
5) Select Arduino as source
6) Name it as you want
Now you have successfully make your account!
8) Now click on add variable
9) Chose a line chart
10) Name your variables and add different icons to them
11) Create all of them and then go to your dashboard
12) In the dashboard, make widget and save it as we will need it afterwards.
Read more: Real Time Monitoring Of Crop Health using Intel Edison