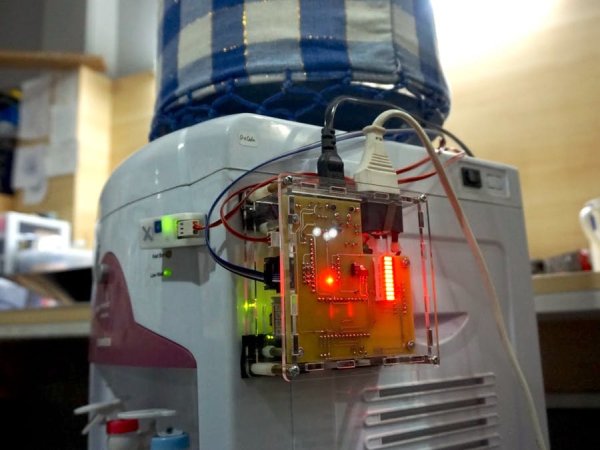
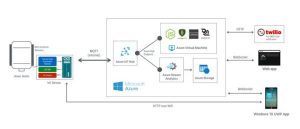
This project is a platform for drinking water monitoring and analytics, consists of IoT device, cloud, and mobile and web app.
Things used in this project
Story
Background
This project focuses on one of the most vital nutrient for our body, drinking water. In Indonesia, the term “gallon” refers to an infrastructure for drinking water: water dispenser, and replaceable water bottle, as apparently the water bottle measurement is in gallon unit.
Detail background and thoughts behind this project are described in my project idea here, that I use for idea submission to World Largest Arduino Maker Challenge. The key objective of the project is building solution around the new Arduino MKR1000.
The project is a simplified version of my company’s real product called HomeX – Smart Gallon. Please note that the product itself is copyrighted.
We decide to share the project’s source code and design, as an effort to share to the community, and it’s intended to showcase:
- Real-world and mid-complex IoT product, combining IoT device, cloud services, analytics, API service, mobile/desktop app, and web-based app
- Real-world use case of some Azure services, especially Azure IoT Hub and Azure Stream Analytics
- Arduino MKR1000 real-world implementation as the core microcontroller of the IoT device. As it’s still beta and not many documentation or discussions found anywhere, it’s quite challenging to use it.
- Albeit still prototype and not yet visually stunning, this project shows a proper experience to setup the device for end user.
- Heavy Object-oriented Programming (OOP) implementation for coding Arduino software, and usage of Eclipse as IDE, instead of Arduino IDE.
How It Works
Before telling much about what it’s all about, let’s take a look this video:
From setting up the IoT device, to monitor and control using UWP app and web app
How It Looks Like
IoT Device
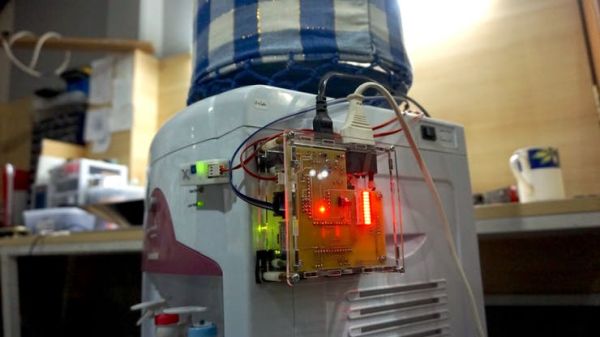
The device prototype case is made from clear acrylic for now to show the internals. It is bigger than it should be, as many components, especially MKR1000, are still put on board through female header.
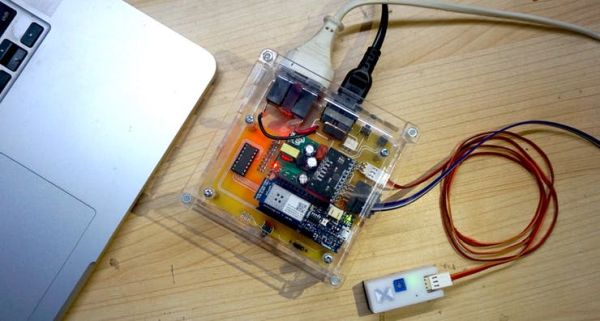 Bottom view. You can see Arduino MKR1000 there.
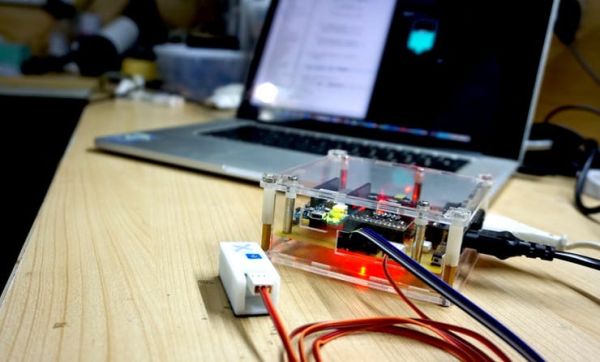 View from side
Web-based Dashboard
For monitoring and controlling devices from web browser.
 Devices overview
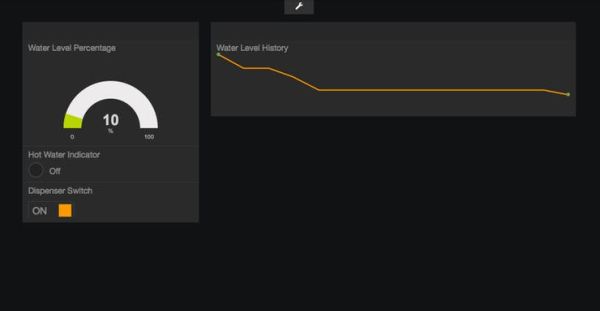 Web dashboard showing water level, hot water indicator, and for turning on/off dispenser
Live website: http://home-x.cloudapp.net:9000
Test account:
- Username: stub2
- Password: stub2
*Please note that the device’s dashboard may not show any data if the actual device is not turned on.
Windows 10 UWP App
An app installable on Windows 10 tablet, desktop, and phone, used to manage Gallon devices, monitor water level and other data, and also set actions to perform upon triggered low water level.
For signing-in to the app, you can use the same test account as dashboard.
 Login screen
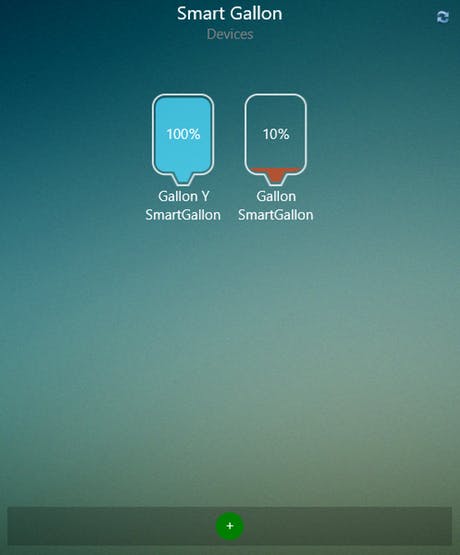 Registered devices
 Setup a device – Choose access point for the device to connect to internet
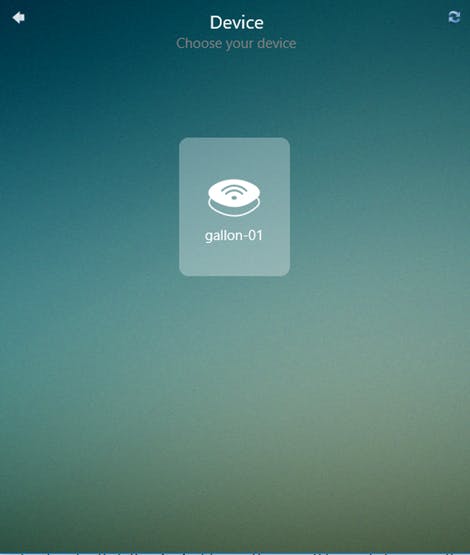 Setup a device – Detected nearby Smart Gallon device
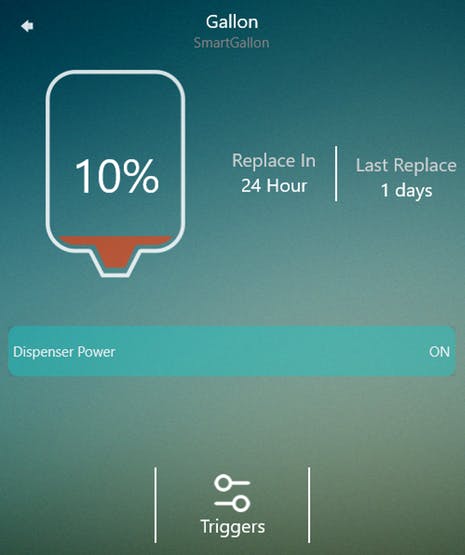 Device details
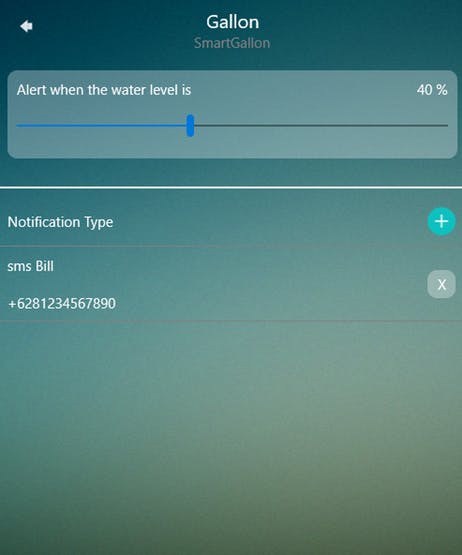 Setup triggers upon low water level
 Contact to SMS/Email/Call upon low water level detected
System Architecture
Such a simple use case doesn’t mean it is simple under the hood.
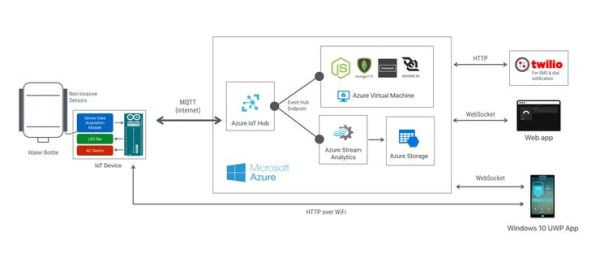
IoT Device
Key components:
- Arduino MKR1000: the brain with built-in WiFi module to connect to internet
- Capacitive sensor: for non-invasive water level sensing in water bottle.
- Light-dependent Resistor module: to detect that hot water LED on dispenser being on or off, in order to notify that hot water is ready
- 10 bars LED bar: for displaying water level percentage in water bottle
- GPIO expander based on PCF8574 to drive 10 LEDs of LED bar, only by using 2 I2C pins.
Capacitive Sensor
I want to highlight the capacitive sensor. It’s used to measure water level inside the bottle by measuring capacitance value at the sensor electrode upon water existence. For measuring capacitance, we leverage MPR121 module, that supports up to 12 electrodes. By using this kind of sensor, it means that the sensor doesn’t have to be physically in touch with water like the one with floating mechanism, or tube-based.
Software
Developing software for the IoT device means developing firmware for Arduino MKR1000. It’s developed using Arduino framework for specific platform target: “hackster.io – MKR1000 build”.
All source code is published on GitHub at this link. For coding it, I don’t use official Arduino IDE, instead I use Arduino Eclipse IDE. To properly open and build the code project, make sure to download and install the Arduino Eclipse IDE V3.
Used 3rd parties libraries:
- WiFi101: obviously for networking stuffs over WiFi
- RTCZero: for accessing RTC on MKR1000 and accessing datetime
- PubSubClient: MQTT client library for publishing JSON message to Azure IoT Hub (device to cloud scenario), and subscribing for JSON command (cloud to device scenario)
- ArduinoJson: for parsing JSON command received from Azure IoT Hub
- Adafruit MPR121: for communication with MPR121 capacitive sensor module
Azure Services
Azure is the heart of the platform. Beside for ingestion device-to-cloud telemetry data, it’s also used for sending cloud-to-device messages (or commands), and later for further analysis (hot or cold path) of ingested data stream. Following Azure services are used:
a. Azure IoT Hub
It’s crucial component that’s front-facing of IoT devices, as it’s used for ingesting data stream from IoT devices and sending command to them.
Communications between Azure IoT Hub and IoT devices are done entirely with native MQTT protocol over secure communication based on TLS/SSL. At the time of developing this project, Azure IoT Hub already supported MQTT v3.1.1. More on MQTT support in Azure Iot Hub is here.
Azure IoT Hub publishes Event Hub compatible endpoint that’s later used by Azure Stream Analytics for further analysis. The endpoint is also used by Node.js-based backend for telemetry data storage and relay to client apps (UWP and web app) through web socket.
b. Azure Stream Analytics Job
In this project, Azure Stream Analytics is used to process data stream received by Azure IoT Hub in realtime. One of processing that’s currently performed is for knowing the rate of water level changes.
Fortunately, Azure Stream Analytics Job already supported input directly from IoT Hub. As for output, currently Azure Table Storage is used for now, but you can use another, Power BI for example.
As for analysis query, for now, I use this query:
With WaterLevelChanges AS (SELECT
    deviceId,
    waterLevelPercent,
    LAG(waterLevelPercent, 1) OVER (LIMIT DURATION(day, 1)) as prevPercent,
    [datetime]

FROM
    [gallon-stream] TIMESTAMP BY [datetime]
WHERE
    LAG(waterLevelPercent, 1) OVER (LIMIT DURATION(day, 1)) <> waterLevelPercent
)
SELECT
    deviceId,
    waterLevelPercent,
    prevPercent,
    LAG([datetime], 1) OVER (LIMIT DURATION(day, 1)) as prevDate,
    [datetime],
    DATEDIFF(second, LAG([datetime], 1) OVER (LIMIT DURATION(day, 1)), [datetime]) as [duration]
INTO
    [gallon-telemetry]
FROM WaterLevelChanges
It seems that the query still can be improved.
For reference, here’s the payload sample ingested by IoT Hub:
[
  {
    "deviceId": "gallon-01",
    "state": 1,
    "waterLevelPercent": 100,
    "datetime": "2016-04-01T02:01:23.000Z",
    "ldr": 0
  },
  {
    "deviceId": "gallon-01",
    "state": 1,
    "waterLevelPercent": 100,
    "datetime": "2016-04-01T02:02:23.000Z",
    "ldr": 0
  },
  {
    "deviceId": "gallon-01",
    "state": 1,
    "waterLevelPercent": 90,
    "datetime": "2016-04-01T02:03:23.000Z",
    "ldr": 0
  },
  {
    "deviceId": "gallon-01",
    "state": 1,
    "waterLevelPercent": 90,
    "datetime": "2016-04-01T02:04:23.000Z",
    "ldr": 0
  },
  {
    "deviceId": "gallon-01",
    "state": 1,
    "waterLevelPercent": 80,
    "datetime": "2016-04-01T02:05:23.000Z",
    "ldr": 0
  },
  {
    "deviceId": "gallon-01",
    "state": 1,
    "waterLevelPercent": 80,
    "datetime": "2016-04-01T02:06:23.000Z",
    "ldr": 0
  },
  {
    "deviceId": "gallon-01",
    "state": 1,
    "waterLevelPercent": 80,
    "datetime": "2016-04-01T02:07:23.000Z",
    "ldr": 0
  },
  {
    "deviceId": "gallon-01",
    "state": 1,
    "waterLevelPercent": 70,
    "datetime": "2016-04-01T02:08:23.000Z",
    "ldr": 0
  },
  {
    "deviceId": "gallon-01",
    "state": 1,
    "waterLevelPercent": 70,
    "datetime": "2016-04-01T02:09:23.000Z",
    "ldr": 0
  }
]
Applying that query and using that input data sample, we can get the output something like this:

From that output, now we know how fast the water level change from one percentage to another. Further analysis will reveal how soon the water in the bottle will be fully empty.
c. Azure Storage Account
For current project, Azure Storage Account, especially table storage, is used as the output of Azure Stream Analytics Job.
d. Azure Virtual Machine
Virtual Machine is used to host:
- Node.js-based backend that consists of REST API and relay to reroute messages from Azure IoT to client apps via web socket
- MongoDB: database engine for storing device’s data
- Dashboard web app
Initially it’s considered to deploy those on Azure Websites. But for simplicity and reducing cost, we use VM for now.
Please refer to attached project repositories:
And read the README file inside them to properly deploy the software.
Web-based Dashboard App
We leverage Freeboard for creating the dashboard. It’s open source project that provides ready-to-use and customizable framework for creating dashboards.
As Freeboard only provides HTML-based frontend framework, we still need to create the backend based on Node.js for:
- User management and authentication
- Device management
- Prepare Freeboard dashboard definition
Some key Node.js modules used:
- Azure IoT Hub SDK for Node.js, obviously for accessing Azure IoT Hub service
- Express, apparently de-facto web framework for Node.js
- socket.io server and client: for communication via web socket
- Twilio Node.js helper library: for sending SMS and making call via Twilio
- Mandrill API for Node.js: for sending email via Mandrill
- MongoDB Node.js native driver, for accessing MongoDB database
One thing to note that the data displayed on dashboard doesn’t directly coming from Azure IoT Hub. Although Freeboard supports data source from MQTT broker and Azure IoT Hub does support MQTT, but that requires us to set the MQTT password which is device’s SAS token on dashboard itself! So instead, data from IoT Hub relayed to dashboard via web socket by Gallon Watcher backend, and that’s why data source on Freeboard dashboard is socket.io.
Windows 10 UWP App
As its premise, Universal Windows Platform allows to develop app targeted for Windows 10 tablet, desktop, and phone based on one codebase. Apparently, we can achieve that by creating this Visual Studio project.
Similar to web-based dashboard, UWP app doesn’t receive data directly from Azure IoT Hub, but instead from Gallon Watcher backend via web socket.
Used libraries that you can install using NuGet:
- SocketIOClientDotNet: for communicating with socket.io server via web socket
- Newtonsof.Json: JSON parser
Deployment
To properly replicate the system in your own environment, especially from software-side, please refer to README file inside each repositories.
As for deploying used Azure services, please follow deployment guideline for each services. No special consideration needed. Some needed parameters:
- Azure IoT Hub: IoT Hub name, iothubowner policy’s key and Shared Access Signature (SAS), Event Hub compatible endpoint’s name and host.
- Azure Storage: storage name and key
- Azure Stream Analytics: input details (from Azure IoT Hub) and output details (from Azure Storage)
Initial state of IoT device, after the first time MKR1000 is flashed, is not connected to internet. We can setup the device’s WiFi connection by using UWP app provided. To sign-in to UWP app and Web-based dashboard, use the provided test account.
Further Improvements
Few areas to improve:
- Water level sensing technique and algorithm. It’s quite challenging to properly translate the measured capacitance to actual water level. There are two many external factors that contribute to noise. Accidentally touching sensor electrodes will contribute more noise. Proper calibration and noise cancellation are certainly needed.
- Further analysis of ingested data. Stream Analytics Job is awesome and so many things that can be done.
- Web-based dashboard should be improved to add more features to match with the UWP app.
- Azure Storage can be used to store IoT device’s firmware to be available for download from device if we want to update the firmware over the air (OTA).
Closing
This project has successfully implemented water level monitoring solution, that leverages Arduino MKR1000, Microsoft Azure services, Microsoft Universal Windows Platform, and Node.js. There are some areas of improvement as noted above.
This project also shows the proper development technique and toolset for developing Arduino software, for the perspective of software developer. My 19 years coding experience really plays much here 🙂
That’s it. Enjoy.
Custom parts and enclosures
Schematics
Code
Source : Project “Gallon” – Smart Drinking Water Monitoring Platform

