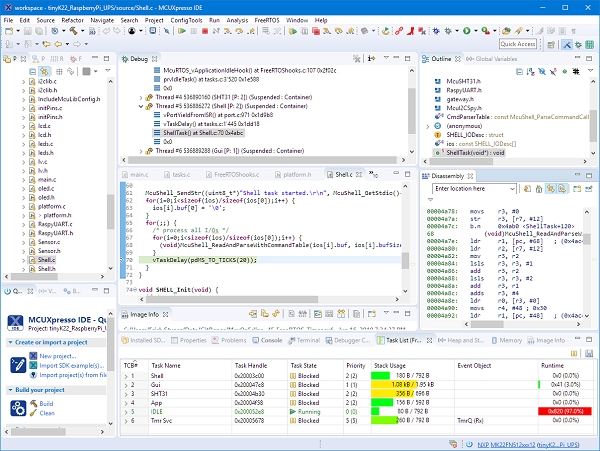
A few days ago NXP has released a new version of their Eclipse IDE flagship: the MCUXpresso IDE v11.0.

The previous v10.3.1 was released back in Feb 2019, and the 11.0 now in June this year matches up with the Fall university semester. I appreciate that the releases are about every 6 months, so this gives me time to use it in my university lecture material and lab work. I had the weekend for trying it out, and I’m very pleased.
On a top level
There are lots improvements in this release for which the release notes are a good starting point. A few things noteworthy on the top level:
- The Eclipse framework has been moved to 4.10.0v201812 with CDT 9.6.0. As a consequence, this is now 64bit on Windows too. It runs on Windows (7,8,10), Ubuntu (16.04 & 18.04 LTS) plus on MacOS (10.11 or later).
- The ARM toolchain has been updated to GCC8 with the 2018q4-major release$
- The MCUXpresso Config tools have been integrated with version 6
- The IDE supports the latest NXP SDK 2.6 release
- Both SEGGER J-Link (v6.44i) and PEMicro debug probe (v4.13) software has been updated
- Extended support for Cortex-M33 based MCUs which includes SWO Trace
As always, the release notes and the user manual are a good source of information.
Below are some times which I have found very useful:
Develop Perspective
The default ‘Develop’ Eclipse perspective has an improved layout. There is is third column in the layout.
The ‘Outline’ and ‘Terminal’ views are now by default included in this perspective.
A new ‘Analysis’ menu gives an easy access to trace, SWO and Power views:
Image Info
This is a new feature/view in the MCUXpresso IDE. It is a kind of ‘super symbol browser’ and very useful to get an overview about the application. It works both for the image of a project or I can load an external image for analysis.
One tab shows the memory areas and how much they are used:
The ‘Memory Content’ tab shows all the symbols, kind of super linker map file which can be sorted or I can search for items. Best of all: I can double-click on an item and it jumps to the source file for it (if applicable).
If the application is compiled -fstack-usage, then it shows the call graph with the needed stack size (nice!):
The view can even compare multiple binaries, very useful to find differences:
Heap and Stack Usage
The MCUXpresso IDE already has excellent (even improved, see next) support for Heap and Stack usage for FreeRTOS projects, it features now as well a view for baremetal (no RTOS) heap and stack usage.
Read more: NEW NXP MCUXPRESSO ECLIPSE IDE V11.0
