Summary of Heart-rate monitor on a small OLED display with MicroPython
This article describes building a heart-rate monitor using a Pulsesensor.com PPG sensor, a Wemos D1 running MicroPython, and a small OLED display. It explains wiring the sensor with its signal pin to the board's analog input, reading ADC values (0–1023) in MicroPython, and observing pulse peaks by logging ADC readings to detect beats and calculate BPM and trace display.
Parts used in the Heart-rate monitor on a small OLED display with MicroPython:
- Wemos D1 board
- Pulsesensor.com heart rate sensor
- Small OLED display
- Wiring/jumper cables
- USB cable for power and serial connection
- Computer or terminal program for logging (example: screen)
Pulse sensors have become popular due to their use in health-monitors like the Fitbit. The sensors used are cheap, simple and pretty reliable at getting a reasonable indication of heart rate in daily use. They work by sensing the change in light absorption or reflection by blood as it pulses through your arteries — a technique jauntily named photoplethysmography (PPG). The rising and falling light signal can be used to identify the pulse, and subsequently calculate heart rate.
Most commercial sensors (Fitbit, etc.) use green-light based sensors and similar sensors are available for use in your own projects. In this project we’re taking a Pulsesensor.com sensor and using it to build a working heart monitor with OLED pulse, BPM and trace display, using MicroPython on a Wemos D1.
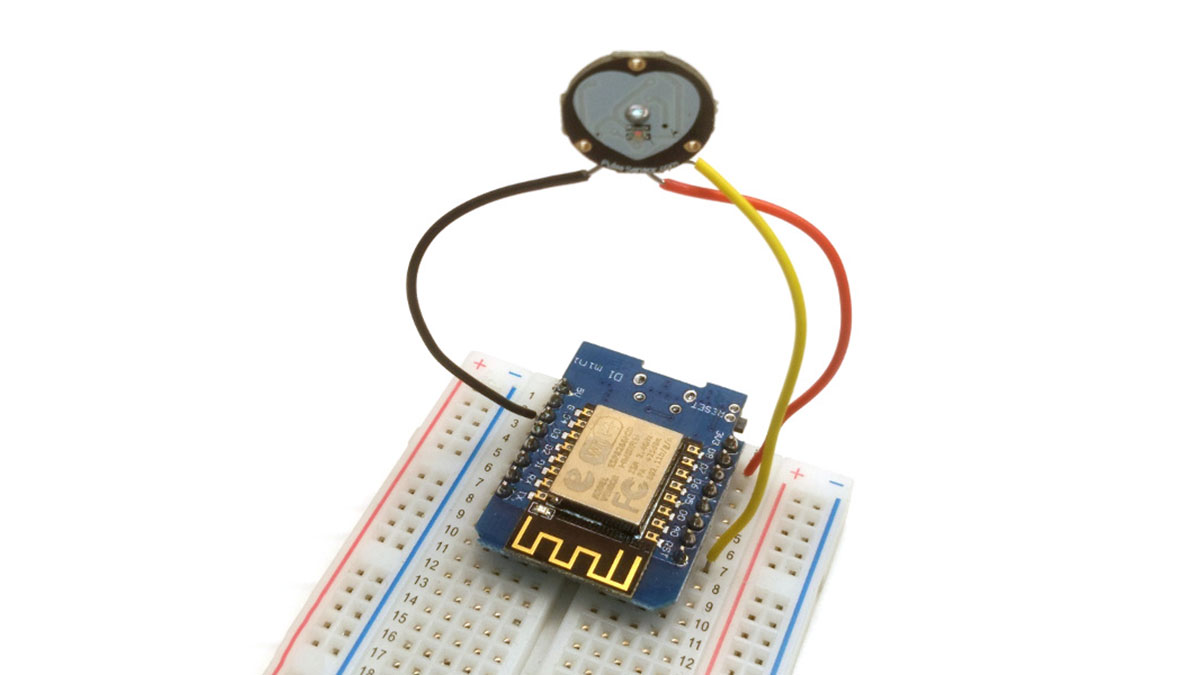
Wiring up the sensor
In this project we’re using an Wemos D1 and a Pulsesensor.com heart rate sensor, but other boards and sensors will also work fine. Wire up the sensor as follows, with the signal (S) pin connected to your board’s analoge input.
Once your sensor is wired to this pin you can use following MicroPython code to read the value from the sensor:
import machine
adc = machine.ADC(0)

>>> adc.read()
550
Note: The values output by this ADC are integers in the range 0-1023. A reading of 550 is equivalent to 0.54 on a 0-1 scale.
Detecting a beat
To get some data to work with I set up an loop to print out the above data to terminal while measuring my own pulse. The output was logged to an outfile using screen -L <device> 115200
Below is a plot showing the resulting output showing a rising peak for each beat.
Read more: Heart-rate monitor on a small OLED display with MicroPython
- What sensor is used for the project?
The project uses a Pulsesensor.com heart rate sensor. - Which microcontroller board is used?
The project uses a Wemos D1 board running MicroPython. - How is the sensor wired to the board?
The sensor signal pin is connected to the board's analog input. - How do you read the sensor in MicroPython?
Use machine.ADC(0) and call adc.read() to get readings. - What range do ADC readings use?
The ADC outputs integers in the range 0 to 1023. - What does a reading of 550 represent?
A reading of 550 corresponds to approximately 0.54 on a 0 to 1 scale. - How can you observe pulse peaks?
Log ADC output to a terminal while measuring a pulse; peaks correspond to heart beats. - What tool was used to log serial output in the article?
The article used screen -L <device> 115200 to log output to a file.