Summary of Harnessing Monitoring Capabilities: Rasp Pi 3B Network Adapter
The article explains how to enable and auto-start monitor mode on a Raspberry Pi using a compatible external WiFi adapter, how to verify support with lsusb, ifconfig, iw dev, and iw phy, and how to install Kismet for packet monitoring. It covers creating a monitor interface, editing wpa_supplicant and /etc/network/interfaces to enable monitor mode at boot, and installing Kismet dependencies, cloning its repo, configuring, and compiling.
Parts used in theMonitoring Mode on Raspberry Pi project:
- Raspberry Pi (e.g., Raspberry Pi 3B+)
- External USB network adapter that supports monitor mode (example: Alfa AWUSO36NH with RT2870/RT3070 chipset)
- MicroSD card with Raspberry Pi OS and internet access
- Power supply for Raspberry Pi
- Optional peripherals: keyboard, mouse, monitor
- Network connection for package installation
The Raspberry Pi 3B+ (as well as all other Raspberry Pi models currently available) comes equipped with built-in WiFi functionality. The “wlan0” interface serves as the default connection gateway alongside Ethernet, yet it lacks the capability to enter “monitoring mode.” In this guide, we’ll demonstrate the steps to ensure that a separate network adapter is capable of monitoring mode and how to activate it. Additionally, we’ll delve into the installation and usage of software that leverages this monitoring mode capability, focusing particularly on kismet.
Materials/Prerequisites
The primary component required is a network adapter capable of monitoring mode and compatible with your Raspberry Pi model. This guide presupposes that you have already installed the requisite drivers, although most network adapters intended for Raspberry Pi should be plug-and-play compatible.
Process
About Monitoring Mode & Some Useful Commands
Monitoring Mode
As implied by its name, monitoring mode enables us to utilize the network adapter for observing traffic between devices and the network, rather than functioning solely as a means of connecting to the network. One significant advantage of monitoring mode is its capability to capture packets without needing to be associated with a specific network.
To illustrate this concept, consider your phone as your starting point (home) and the wustl-2.0 network as your destination. Just as a traffic camera records your movement from home to destination, a network adapter in monitoring mode similarly observes the flow of data. When your phone transmits packets of information to a network, the network adapter passively detects these packets. For the purposes of this tutorial, it can then record the MAC Address of your phone.
lsusb
The “lsusb” command provides a list of all devices currently connected to your Pi. Typically, the initial entries represent standard components of the Pi. Following these defaults, you should observe peripherals such as mice or keyboards that have been connected to your Pi. It’s crucial to ensure that your network adapter is listed, along with its chipset. If it’s not listed, double-check your physical connections. The chipset holds significance as it determines the support for certain functions and whether they are available without additional installations. For instance, if you’re using the Alfa AWUSO36NH adapter, the output should resemble the following. The RT2870/RT3070 chipset inherently supports monitoring mode.
pi@raspberrypi:~ $ lsusb
Bus 001 Device 004: ID 148f:3070 Ralink Technology, Corp. RT2870/RT3070 Wireless Adapter '''// Here we can see the network adapter connected. It has a unique ID, the company name, and the chip set'''
Bus 001 Device 003: ID 0424:ec00 Standard Microsystems Corp. SMSC9512/9514 Fast Ethernet Adapter
Bus 001 Device 002: ID 0424:9514 Standard Microsystems Corp. SMC9514 Hub
Bus 001 Device 001: ID 1d6b:0002 Linux Foundation 2.0 root hub
ifconfig
Running the command “ifconfig” will provide you with information regarding your current network setup. While there may be some extraneous details, pay attention to the presence of two interfaces labeled “wlan0” and “wlan1.” Typically, these interfaces correspond to your onboard WiFi connection and your network adapter, respectively.
pi@raspberrypi:~ $ ifconfig
eth0: flags=4099<UP,BROADCAST,MULTICAST>  mtu 1500
        ether b8:27:eb:df:15:76  txqueuelen 1000  (Ethernet)
        RX packets 0  bytes 0 (0.0 B)
        RX errors 0  dropped 0  overruns 0  frame 0
        TX packets 0  bytes 0 (0.0 B)
        TX errors 0  dropped 0 overruns 0  carrier 0  collisions 0

lo: flags=73<UP,LOOPBACK,RUNNING>  mtu 65536
        inet 127.0.0.1  netmask 255.0.0.0
        inet6 ::1  prefixlen 128  scopeid 0x10<host>
        loop  txqueuelen 1000  (Local Loopback)
        RX packets 172  bytes 13828 (13.5 KiB)
        RX errors 0  dropped 0  overruns 0  frame 0
        TX packets 172  bytes 13828 (13.5 KiB)
        TX errors 0  dropped 0 overruns 0  carrier 0  collisions 0

'''// MAKE SURE YOU HAVE SOMETHING LIKE THIS'''
wlan1: flags=4163<UP,BROADCAST,RUNNING,MULTICAST>  mtu 1500
        unspec 00-C0-CA-97-AD-30-30-30-00-00-00-00-00-00-00-00  txqueuelen 1000  (UNSPEC)
        RX packets 23386  bytes 2945303 (2.8 MiB)
        RX errors 0  dropped 23386  overruns 0  frame 0
        TX packets 0  bytes 0 (0.0 B)
        TX errors 0  dropped 0 overruns 0  carrier 0  collisions 0

wlan0: flags=4163<UP,BROADCAST,RUNNING,MULTICAST>  mtu 1500
        inet 172.27.163.103  netmask 255.255.255.0  broadcast 172.27.163.255
        inet6 fe80::169b:bf52:d27b:bba4  prefixlen 64  scopeid 0x20<link>
        ether b8:27:eb:8a:40:23  txqueuelen 1000  (Ethernet)
        RX packets 854  bytes 929035 (907.2 KiB)
        RX errors 0  dropped 2  overruns 0  frame 0
        TX packets 823  bytes 99410 (97.0 KiB)
        TX errors 0  dropped 0 overruns 0  carrier 0  collisions 0
iw dev
Using the command “iw dev” provides additional details about your network interfaces. Of particular significance is identifying the physical layer utilized by each interface. Typically, you’ll observe “wlan0” associated with “phy0” and “wlan1” associated with “phy1”.
pi@raspberrypi:~ $ iw dev
phy#1
	Interface wlan1 '''// MAKE SURE YOU HAVE SOMETHING LIKE THIS'''
		ifindex 11
		wdev 0x100000008
		addr 00:c0:ca:97:ad:30
		type monitor
		channel 1 (2412 MHz), width: 20 MHz (no HT), center1: 2412 MHz
		txpower 30.00 dBm
phy#0
	Unnamed/non-netdev interface
		wdev 0x2
		addr 7e:c7:45:13:f2:b8
		type P2P-device
		txpower 31.00 dBm
	Interface wlan0
		ifindex 3
		wdev 0x1
		addr b8:27:eb:8a:40:23
		ssid wustl-2.0
		type managed
		channel 1 (2412 MHz), width: 20 MHz, center1: 2412 MHz
		txpower 31.00 dBm
iw phy phy1 info
After establishing the physical layer, we can execute the command “iw phy phy1 info” (assuming our network adapter is linked to phy1). Typically, a network adapter is set to the “managed” mode by default. However, it is important to verify that it supports monitor mode, regardless of any descriptions provided by sellers like Amazon. In the list of supported interface modes, the “monitor” mode should be present. If it is not, you will require a different network adapter.
pi@raspberrypi:~ $ iw phy phy1 info
Wiphy phy1
	max # scan SSIDs: 4
	max scan IEs length: 2257 bytes
	max # sched scan SSIDs: 0
	max # match sets: 0
	max # scan plans: 1
	max scan plan interval: -1
	max scan plan iterations: 0
	Retry short long limit: 2
	Coverage class: 0 (up to 0m)
	Device supports RSN-IBSS.
	Supported Ciphers:
		* WEP40 (00-0f-ac:1)
		* WEP104 (00-0f-ac:5)
		* TKIP (00-0f-ac:2)
		* CCMP-128 (00-0f-ac:4)
		* CCMP-256 (00-0f-ac:10)
		* GCMP-128 (00-0f-ac:8)
		* GCMP-256 (00-0f-ac:9)
	Available Antennas: TX 0 RX 0
	Supported interface modes:
		 * IBSS
		 * managed
		 * AP
		 * AP/VLAN
		 * monitor  '''// MAKE SURE YOU SEE THIS'''
		 * mesh point
	Band 1:
		Capabilities: 0x17e
			HT20/HT40
			SM Power Save disabled
			RX Greenfield
			RX HT20 SGI
			RX HT40 SGI
			RX STBC 1-stream
			Max AMSDU length: 3839 bytes
			No DSSS/CCK HT40
		Maximum RX AMPDU length 32767 bytes (exponent: 0x002)
		Minimum RX AMPDU time spacing: 2 usec (0x04)
		HT TX/RX MCS rate indexes supported: 0-7, 32
		Bitrates (non-HT):
			* 1.0 Mbps
			* 2.0 Mbps (short preamble supported)
			* 5.5 Mbps (short preamble supported)
			* 11.0 Mbps (short preamble supported)
			* 6.0 Mbps
			* 9.0 Mbps
			* 12.0 Mbps
			* 18.0 Mbps
			* 24.0 Mbps
			* 36.0 Mbps
			* 48.0 Mbps
			* 54.0 Mbps
		Frequencies:
			* 2412 MHz [1] (30.0 dBm)
			* 2417 MHz [2] (30.0 dBm)
			* 2422 MHz [3] (30.0 dBm)
			* 2427 MHz [4] (30.0 dBm)
			* 2432 MHz [5] (30.0 dBm)
			* 2437 MHz [6] (30.0 dBm)
			* 2442 MHz [7] (30.0 dBm)
			* 2447 MHz [8] (30.0 dBm)
			* 2452 MHz [9] (30.0 dBm)
			* 2457 MHz [10] (30.0 dBm)
			* 2462 MHz [11] (30.0 dBm)
			* 2467 MHz [12] (disabled)
			* 2472 MHz [13] (disabled)
			* 2484 MHz [14] (disabled)
	Supported commands:
		 * new_interface
		 * set_interface
		 * new_key
		 * start_ap
		 * new_station
		 * new_mpath
		 * set_mesh_config
		 * set_bss
		 * authenticate
		 * associate
		 * deauthenticate
		 * disassociate
		 * join_ibss
		 * join_mesh
		 * set_tx_bitrate_mask
		 * frame
		 * frame_wait_cancel
		 * set_wiphy_netns
		 * set_channel
		 * set_wds_peer
		 * probe_client
		 * set_noack_map
		 * register_beacons
		 * start_p2p_device
		 * set_mcast_rate
		 * connect
		 * disconnect
		 * set_qos_map
		 * Unknown command (121)
	Supported TX frame types:
		 * IBSS: 0x00 0x10 0x20 0x30 0x40 0x50 0x60 0x70 0x80 0x90 0xa0 0xb0 0xc0 0xd0 0xe0 0xf0
		 * managed: 0x00 0x10 0x20 0x30 0x40 0x50 0x60 0x70 0x80 0x90 0xa0 0xb0 0xc0 0xd0 0xe0 0xf0
		 * AP: 0x00 0x10 0x20 0x30 0x40 0x50 0x60 0x70 0x80 0x90 0xa0 0xb0 0xc0 0xd0 0xe0 0xf0
		 * AP/VLAN: 0x00 0x10 0x20 0x30 0x40 0x50 0x60 0x70 0x80 0x90 0xa0 0xb0 0xc0 0xd0 0xe0 0xf0
		 * mesh point: 0x00 0x10 0x20 0x30 0x40 0x50 0x60 0x70 0x80 0x90 0xa0 0xb0 0xc0 0xd0 0xe0 0xf0
		 * P2P-client: 0x00 0x10 0x20 0x30 0x40 0x50 0x60 0x70 0x80 0x90 0xa0 0xb0 0xc0 0xd0 0xe0 0xf0
		 * P2P-GO: 0x00 0x10 0x20 0x30 0x40 0x50 0x60 0x70 0x80 0x90 0xa0 0xb0 0xc0 0xd0 0xe0 0xf0
		 * P2P-device: 0x00 0x10 0x20 0x30 0x40 0x50 0x60 0x70 0x80 0x90 0xa0 0xb0 0xc0 0xd0 0xe0 0xf0
	Supported RX frame types:
		 * IBSS: 0x40 0xb0 0xc0 0xd0
		 * managed: 0x40 0xd0
		 * AP: 0x00 0x20 0x40 0xa0 0xb0 0xc0 0xd0
		 * AP/VLAN: 0x00 0x20 0x40 0xa0 0xb0 0xc0 0xd0
		 * mesh point: 0xb0 0xc0 0xd0
		 * P2P-client: 0x40 0xd0
		 * P2P-GO: 0x00 0x20 0x40 0xa0 0xb0 0xc0 0xd0
		 * P2P-device: 0x40 0xd0
	software interface modes (can always be added):
		 * AP/VLAN
		 * monitor
	valid interface combinations:
		 * #{ AP, mesh point } <= 8,
		   total <= 8, #channels <= 1
	HT Capability overrides:
		 * MCS: ff ff ff ff ff ff ff ff ff ff
		 * maximum A-MSDU length
		 * supported channel width
		 * short GI for 40 MHz
		 * max A-MPDU length exponent
		 * min MPDU start spacing
	Device supports TX status socket option.
	Device supports HT-IBSS.
	Device supports SAE with AUTHENTICATE command
	Device supports low priority scan.
	Device supports scan flush.
	Device supports AP scan.
	Device supports per-vif TX power setting
	Driver supports full state transitions for AP/GO clients
	Driver supports a userspace MPM
	Device supports configuring vdev MAC-addr on create.
Enabling Monitor Mode and Configuring Boot Options/WiFi Options
Enable Monitor Mode via Command Line
If everything has proceeded smoothly up to this point, you should be able to incorporate a monitoring interface without encountering any difficulties. Execute the command “sudo iw phy phy1 interface add mon1 type monitor” to accomplish this task. Verify its success by running “iw dev” once more.
pi@raspberrypi:~ $ sudo iw phy phy1 interface add mon1 type monitor
pi@raspberrypi:~ $ iw dev
phy#1
	Interface mon1  '''// YOU SHOULD NOW SEE mon1'''
		ifindex 6
		wdev 0x100000003
		addr 00:c0:ca:97:ad:30
		type monitor
		txpower 30.00 dBm
phy#0
	Unnamed/non-netdev interface
		wdev 0x2
		addr 4a:f1:14:e3:78:a1
		type P2P-device
		txpower 31.00 dBm
	Interface wlan0
		ifindex 3
		wdev 0x1
		addr b8:27:eb:8a:40:23
		ssid wustl-guest-2.0
		type managed
		channel 1 (2412 MHz), width: 20 MHz, center1: 2412 MHz
		txpower 31.00 dBm
Configure WiFi Network
If you’ve reached this point without encountering significant issues, you’re likely in good shape. Your network adapter should support monitoring mode and have successfully entered it. Now, even though the Raspberry Pi likely already configured your WiFi networks automatically, we’ll double-check everything to ensure it’s functioning properly. To edit the wpa_supplicant configuration file, use the command “sudo nano /etc/wpa_supplicant/wpa_supplicant.conf”. If you’re unfamiliar with nano, it’s a straightforward text editor integrated directly into the command line. The configuration file is located in /etc/wpa_supplicant/ (since we’re not currently in that directory), and it’s named wpa_supplicant.conf. You should see something similar to the example below.
sudo nano /etc/wpa_supplicant/wpa_supplicant.conf
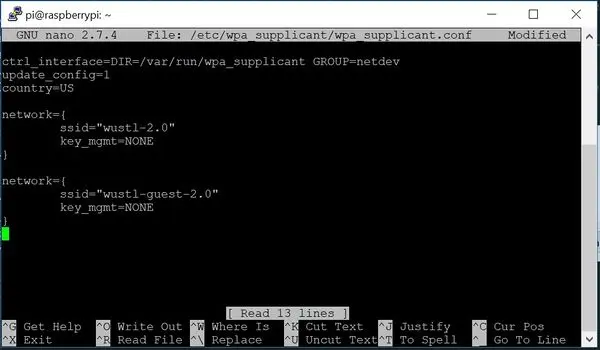
If you don’t find the exact configuration, that’s okay. However, if it’s empty, it’s necessary to include at least one network configuration. Assuming you’re a student at WashU, you’re familiar with connecting to WiFi using the wustl-key. If you were to connect to a more traditional WiFi network, you might see the key_mgmt set to something like WPA2-psk, and you would need to add another identifier “psk=YOUR_PASSWORD”. However, in this case, assuming you’re on a WashU network similar to ours, key_mgmt is set to NONE. There are additional options for setting up your WiFi networks, but this is the bare minimum required.
To edit the file, simply type to access the configuration file. Once you’re done, press ctrl+X to exit, and y to save. Alternatively, you can save by pressing ctrl+O, then exit using ctrl+X.
Start Network Adapter in Monitoring Mode on Boot
Moving forward, our objective is to ensure that the network adapter enters monitor mode automatically upon every boot on the Pi. To achieve this, we’ll be modifying the network interfaces configuration file. It’s important to note that this file is sensitive, and any improper modifications may disrupt your WiFi connection. We strongly advise making a backup copy of the file or taking a picture of it before making any changes. To edit the file, you can use the command “sudo nano /etc/network/interfaces”. Below, you’ll find a sample configuration, though yours may differ significantly. The specific addition required to initiate monitor mode for the adapter is also provided below for reference.
sudo nano /etc/network/interfaces
# Add these lines to your file
allow-hotplug wlan1
 iface wlan1 inet manual
 pre-up iw phy phy1 interface add mon1 type monitor
 pre-up iw dev wlan1 del
 pre-up ifconfig mon1 up
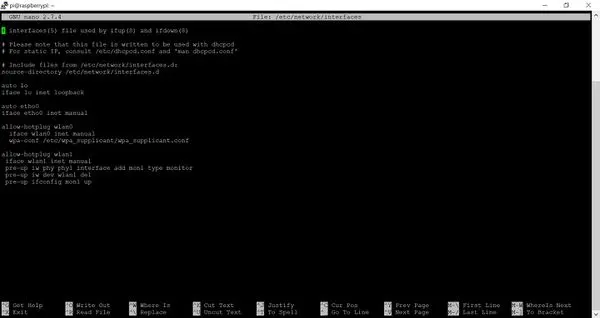
Exercise caution as you proceed, as these steps involve configuring your WiFi network. Pay close attention to the original setup of your files. While the provided code snippet in the image above should function properly, there’s a possibility that it may not align with your specific setup. Additionally, remember that in Python, indentation is crucial. Consistency is key; if you’re indenting with two spaces, maintain that formatting throughout your code and avoid mixing tabs.
Once completed, you should be able to reboot and verify that your network adapter has successfully booted in monitor mode.
reboot
pi@raspberrypi:~ $ iw dev
phy#1
        Interface mon1
                ifindex 6
                wdev 0x100000003
                addr 00:c0:ca:97:ad:30
                type monitor
                txpower 30.00 dBm
phy#0
        Unnamed/non-netdev interface
                wdev 0x2
                addr 4a:f1:14:e3:78:a1
                type P2P-device
                txpower 31.00 dBm
        Interface wlan0
                ifindex 3
                wdev 0x1
                addr b8:27:eb:8a:40:23
                ssid wustl-guest-2.0
                type managed
                channel 6 (2437 MHz), width: 20 MHz, center1: 2437 MHz
                txpower 31.00 dBm
Adding Monitoring Tools (Kismet)
Up to this point, we’ve activated monitor mode on the network adapter upon startup. However, how do we exert control over the network adapter to achieve our desired actions? This is where the necessity for monitoring software arises. Among the well-known options are Wireshark and Kismet. Here, we’ll focus on the fundamental steps of installing Kismet and setting it up. It’s important to note that software evolves, and Kismet’s functionality may vary, be updated, or potentially not function at all by the time you encounter this information. For the most current process, refer to external resources provided on this page.
Install Dependencies
Begin by installing the necessary dependencies for Kismet. These dependencies encompass the libraries or packages essential for Kismet’s operation.
$ sudo apt install build-essential git libmicrohttpd-dev pkg-config zlib1g-dev libnl-3-dev libnl-genl-3-dev libcap-dev libpcap-dev libnm-dev libdw-dev libsqlite3-dev libprotobuf-dev libprotobuf-c-dev protobuf-compiler protobuf-c-compiler libsensors4-dev
Each dependency must be installed sequentially. While the output doesn’t require meticulous attention, it’s essential to ensure that there are no significant errors or command issues. Additionally, we require a package called python-requests.
sudo apt install python python-setuptools python-protobuf python-requests
This should cover all your requirements, but there are numerous optional enhancements available. Please refer to the external resource for more details.
Download kismet from GitHub & Install
Clone the repository by running the following command:
“`
git clone https://www.kismetwireless.net/git/kismet.git
“`
Navigate into the folder containing the Kismet files and proceed with the configuration:
“`
cd kismet
./configure
“`
To compile Kismet, you can use the `make` command. Optionally, you can increase the speed of compilation by utilizing multiple CPU cores with the `make -j CORE_NUMBER` command, but be cautious as this may overload your Raspberry Pi and cause crashes. For example, `make -j 4` will utilize all four cores. However, it’s advisable to stick to a single core using `make` to ensure stability. Please note that compilation may take a significant amount of time, typically around 30 minutes to 1 hour. If the compilation fails, consider reducing the number of cores and check your RAM allocation if you encounter a virtual memory error.
- Does the Raspberry Pi built-in WiFi support monitor mode?
No, the built-in wlan0 interface lacks the capability to enter monitoring mode; a separate adapter is needed. - How do I check connected USB devices and chipset for the adapter?
Use the lsusb command to list connected devices and identify the adapter and chipset. - How can I see my network interfaces and confirm adapter presence?
Run ifconfig to view interfaces like wlan0 and wlan1 and confirm the adapter is listed. - How do I identify the physical phy for my adapter and its mode?
Use iw dev to list phys and interfaces; wlan0 is usually phy0 and the USB adapter often shows as phy1. - How do I verify the adapter supports monitor mode?
Run iw phy phyX info and check Supported interface modes for monitor in the list. - How do I enable a monitor interface manually?
Execute sudo iw phy phy1 interface add mon1 type monitor and verify with iw dev. - How can I make the adapter enter monitor mode at boot?
Edit /etc/network/interfaces and add pre-up commands like iw phy phy1 interface add mon1 type monitor, iw dev wlan1 del, and ifconfig mon1 up for wlan1. - How do I edit WiFi configurations for the Pi?
Edit /etc/wpa_supplicant/wpa_supplicant.conf using sudo nano to ensure network entries are present. - How do I install Kismet and its dependencies?
Install dependencies with apt (list provided), then git clone https://www.kismetwireless.net/git/kismet.git, run ./configure, and compile with make. - What should I do if Kismet compilation fails due to memory?
Reduce parallel make jobs (use make instead of make -j CORE_NUMBER) and check RAM allocation.