Summary of Filtering Noisy Arduino Measurements
This article explains how to reduce noise in Arduino sensor data using three filtering methods: Averaging, Running Average, and Exponential Filter. Implemented via MegunoLink, these techniques smooth noisy thermistor readings by comparing raw data against filtered results on a Time Plot Visualizer. While effective at removing signal noise, the filters may introduce a slight lag in response time.
Parts used in the Filtering Noisy Arduino Measurements:
- Arduino Uno
- MegunoLink software
- Thermistor
- Analog-input 0
- 100kΩ resistance
- Voltage divider configuration
Measurements from the real world often contain noise. Loosely speaking, noise is just the part of the signal you didn’t want. Maybe it comes from electrical noise: the random variations you see when calling analogRead on a sensor that should be stable. Noise also arises from real effects on the sensor. Vibration from the engine adds noise if you’re measuring the acceleration of a go-kart, for example. Filtering is a method to remove some of the unwanted signal to leave a smoother result.
Filters
We’ll use MegunoLink to compare three different filters:
- Averaging
- Running average
- Expotential filter
MegunoLink’s Time Plot Visualizer will be used to show both the raw, unfiltered, data and the output from the filter. Comparing the raw and filtered on a single plot lets us easily see the effect of the filter. The filters will smooth the data but they can also introduce a lag.
Something to Filter
To generate some ‘noisy’ data for filtering a thermistor was connected to analog-input 0 on an Arduino Uno. A thermistor is a resistor whose resistance changes with temperature. As temperature increases, resistance goes down; as temperature decreases, resistance goes up. The thermistor was connected in a voltage divider configuration with one leg connected to ground and the other to the analog-input. A 100kΩ resistance was connected between the 3.3V output of the Arduino and the analog-input to provide current for the thermistor.
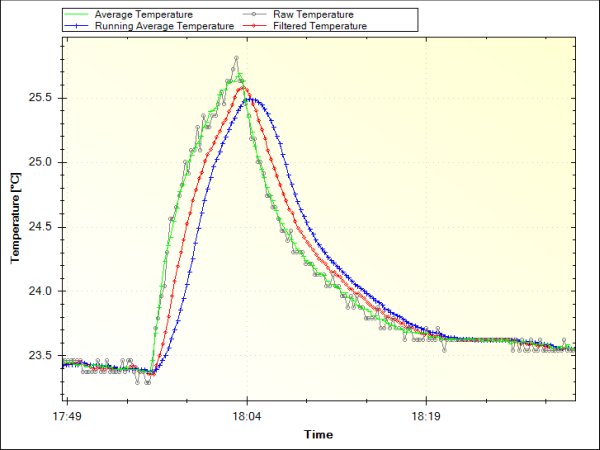
The temperature measured using a thermistor connected to an Arduino was plotted in MegunoLink. Different filters were compared to see which one smoothed the temperature measurements best.
To measure temperature, the analog value was read. Then the raw analog value was converted to temperature, in degrees Celsius, using the following Arduino code:
After applying the various filters, the data was sent to MegunoLink for plotting:
Filtering Algorithms
The three filtering algorithms we are going to look at are:
- Averaging
- Running average
- Exponential filter
The screenshot from MegunoLink below shows these algorithms together. A small rise in temperature was created by touching the thermistor to see how the different filters would respond. The grey line is the raw temperature measurement. It is pretty good with not much noise. But there is still room for improvement.
Read more: Filtering Noisy Arduino Measurements
- What causes noise in real-world measurements?
Noise arises from electrical variations during analog reads or physical effects like engine vibration. - How can you compare raw and filtered data?
MegunoLink's Time Plot Visualizer displays both raw and filtered data on a single plot for easy comparison. - What are the three filters compared in the article?
The article compares Averaging, Running average, and Exponential filter algorithms. - Can filters remove all unwanted signals completely?
Filters remove some unwanted signal but they can also introduce a lag while smoothing data. - How was temperature measured in this project?
A thermistor connected to analog-input 0 was used in a voltage divider configuration with a 100kΩ resistor. - What is the relationship between temperature and thermistor resistance?
As temperature increases, resistance goes down; as temperature decreases, resistance goes up. - Why use MegunoLink for this experiment?
MegunoLink allows users to visualize the effect of different filters by plotting raw and filtered data together.