Summary of FabECG: a simple electrocardiogram board
This article details the construction of a DIY electrocardiogram (ECG) board capable of measuring differential voltage signals from the skin, with potential applications for EEG. The project utilizes soft fabric electrodes from a Zeo headset and relies on an Arduino for signal sampling and processing. The circuit employs two amplification stages using AD620 and CA3140 chips, featuring filtering to remove noise and a virtual ground setup to handle single-supply operation.
Parts used in the FabECG:
- Tiny45 micro-controller
- Laptop
- AD620 instrumentation amplifier
- CA3140 amplifier
- Potentiometer
- Arduino micro-controller board
- Soft fabric electrodes from Zeo Mobile EEG headset
- 6.8 pF feedback capacitor (C1)
- 10 nF capacitor (PCB version replacement)
- 25 kOhm resistors (filter bank)
- 22 kOhm resistors (PCB version replacement)
- 49.9 kOhm resistor
- 2.2 kOhm gain resistor (R_G)
- Zero ohm resistors
- 3314 1M surface mount trimmer from Bourns
Technologies for rudimentary physiological sensing are getting cheaper and easier to implement. Consider, for instance, these non-contact sensors from UCSD which can be used to take an EEG through hair or an ECG through a T-shirt! One can even make a simple oscilloscope to digitize, store and view the signal using only a Tiny45 micro-controller and a laptop: tiny45 oscilloscope
Cool general-purpose commercial hardware in this category (from IMEC). And a nice book on ECG.
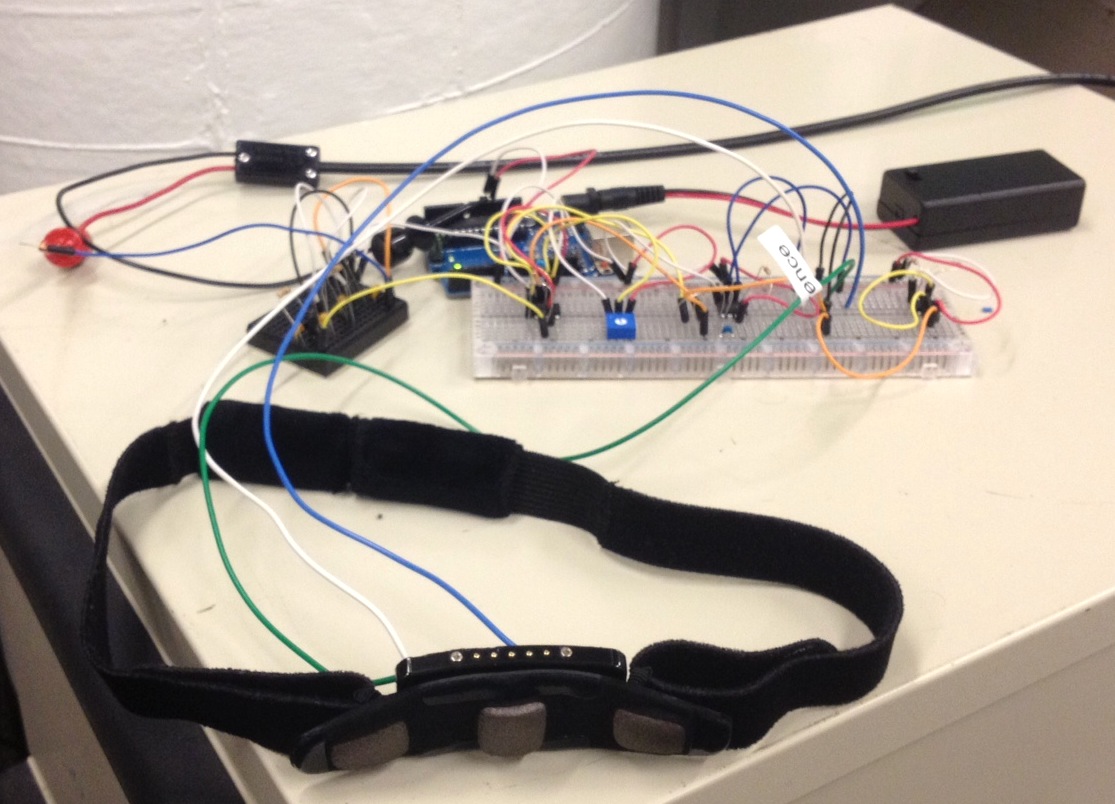
This week Charles Fracchia and I made a simple electro-cardiogram board (see also Charles’s documentation here) which should also be in principle capable of EEG and many other such differential voltage measurements on the skin, especially once digital post-processing of the signal is implemented. The system uses the soft fabric electrodes from the headband of the Zeo Mobile EEG headset. This required the sacrifice of one Zeo but in the future this should be easy to mimic using home-made fabric electrodes or other non-contact sensors.
DISCLAIMER: We make no claims about the safety of the below techniques or about their appropriateness for any purpose. Use at your own risk and consult experts on electronics safety.
We based the system on two references: Chipstein’s EEG circuit and this EEG circuit from Charles Moyes and Mengxiang Jiang at Cornell.
For digitizing the amplified ECG signal, we also borrowed this Arduino and Processing code from Chipstein and used this Matlab code modified from the Cornell team, in conjunction with this Arduino code for grabbing the samples.
Circuit design
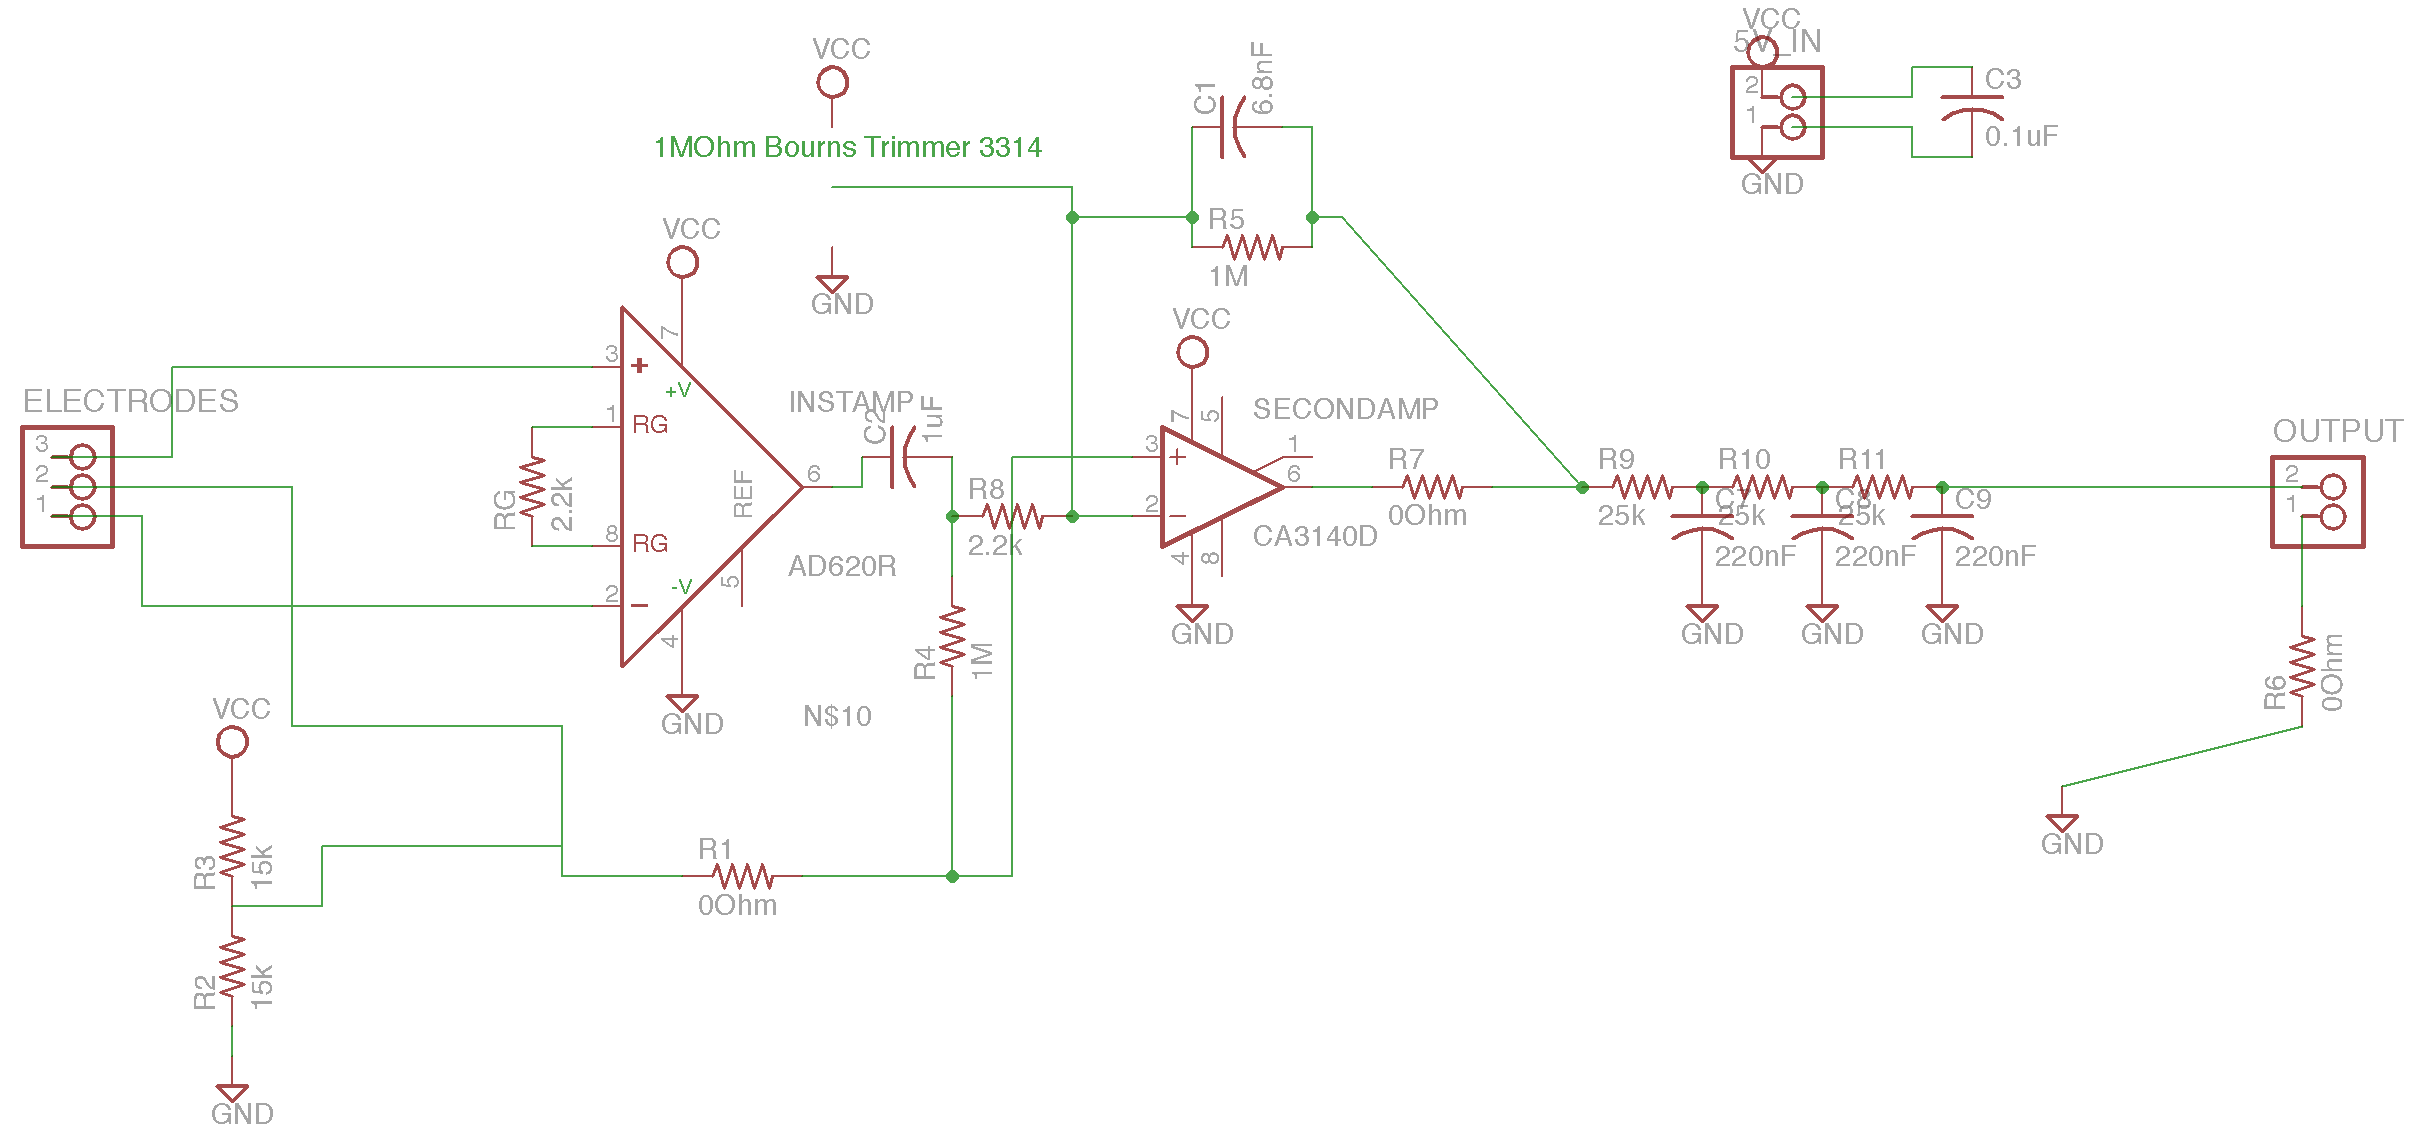
Schematic:
Single-sided PCB:
Eagle Files: .zip
Part list: .txt and don’t forget the 3314 1M surface mount trimmer from Bourns for the PCB version.
Following the same idea as the Chipstein and Cornell designs, the circuit uses an instrumentation amplifier (the AD620) to take the voltage difference between two spots on the body. A second amplifier (the CA3140) amplifies this differential signal. A potentiometer is used to siphon off current from the negative input of the second amplifier, and tuned to remove the DC offset resulting from the inevitable and unpredictable static voltage differences between any two spots on the body: unless removed, the DC offset causes the second amplifier to saturate its output at power or ground. Because we power the amplifiers using only the +5V and ground levels from an Arduino (or other micro-controller board), we need to split the supplies for the amplifiers, which require both a positive and a negative supply line. To do so, we use a voltage divider circuit to define a virtual ground at 5V/2 = 2.5V, and then use +5V and Arduino ground as the positive and negative supply lines, respectively. An electrode held at ground electrode is also placed on the body at a third location. Low and high pass filtering are performed in-between amplification steps and during the second amplification step, and then a bank of three low-pass filters follows after amplification to remove additional 60 Hz noise. Those interested in understanding the exact frequency response of the system should do a full calculation (e.g., using the Op Amp golden rules and the rules for frequency-dependent impedance of resistors and capacitors) or a Spice simulation, because the filters going into and through the second amplification stage cannot be treated simply as individual high and low pass filters in series. In addition to serving as the power source, the Arduino is also used to sample the amplified signal through one of its analog input ports and to shuttle the signal to a computer over serial.
According to the data sheet: Gain = (49.9 kOhm / R_G) + 1 where R_G is the gain resistor. Therefore a 49.4 * (10^3)/22 = 2.2 kOhm R_G resistor leads to a gain in the first stage of amplification of around 23. The second amplifier should give an additional factor of around 1 megaOhm/(2.2 kOhm) = 455. The filtering may remove some frequency components. So the total gain is over 1e4, theoretically. In the below, we’re usually measuring signals of around 1V, which is about 1000x higher than the millivolt-range signals characteristic of ECG, even after filtering, and even using the fabric electrodes.
Single-sided PCB
We added zero ohm resistors to allow one trace to hop over another and routed the circuit using Eagle software. We then milled the traces on a Roland MODELA mini mill using a 1/64 inch end-mill and a 1/32 inch end-mill to cut out the border of the board. To do so, we exported PNG files from Eagle at 2300 dpi resolution and the processed them and sent them to the MODELA using the Fab Modules software. The top layer was used for the traces and the dimension layer for the board boundary. For the board version we replaced the 6.8 pF feedback capacitor C1 with a 10 nF capacitor and the 25 kOhm resistors in the filter bank with 22 kOhm resistors, with no negative effect.
For more detail: FabECG: a simple electrocardiogram board
- How is the DC offset removed in the circuit?
A potentiometer siphons off current from the negative input of the second amplifier to tune and remove the DC offset. - Can this system be used for EEG measurements?
Yes, the system is in principle capable of EEG and other differential voltage measurements on the skin once digital post-processing is implemented. - What components are used to split the power supplies for the amplifiers?
A voltage divider circuit defines a virtual ground at 2.5V to allow the use of +5V and Arduino ground as positive and negative supply lines. - How is the total theoretical gain calculated for the first stage?
The gain is calculated using the formula Gain = (49.9 kOhm / R_G) + 1, where a 2.2 kOhm R_G results in a gain of around 23. - What software was used to route the circuit design?
Eagle software was used to route the circuit and export PNG files for milling. - Does the PCB version use different component values than the original schematic?
Yes, the PCB version replaces the 6.8 pF feedback capacitor with a 10 nF capacitor and uses 22 kOhm resistors instead of 25 kOhm. - How is the amplified signal transmitted to a computer?
The Arduino samples the signal through an analog input port and shuttles it to a computer over serial. - What type of electrodes were utilized in this specific build?
The system uses soft fabric electrodes sourced from the headband of a Zeo Mobile EEG headset.