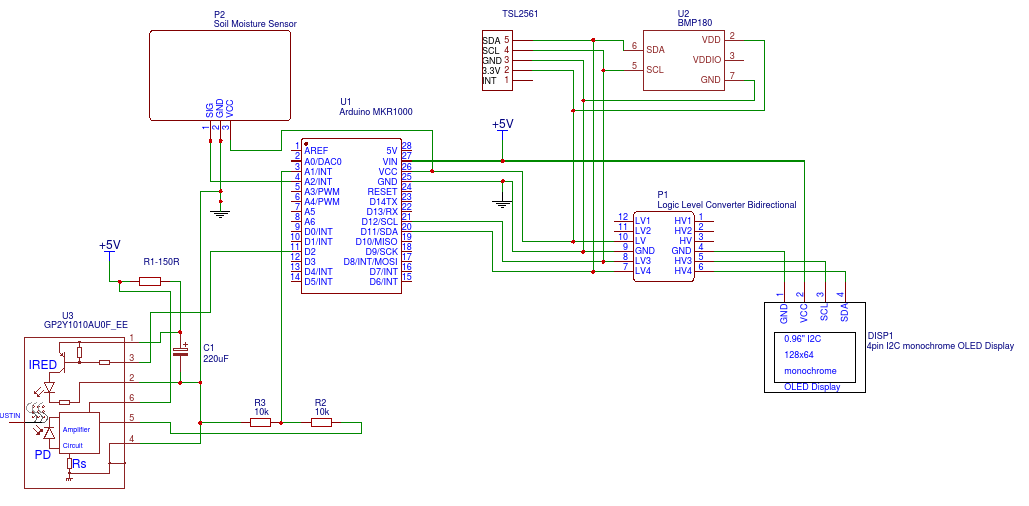
#define CAYENNE_PRINT Serial  // Comment this out to disable prints and save space
#include <CayenneMQTTMKR1000.h>

#include <Wire.h>
#include <Adafruit_Sensor.h>
#include <Adafruit_SSD1306.h>
#include <Adafruit_BMP085_U.h>
#include <Adafruit_TSL2561_U.h>

#define OLED_RESET 4
Adafruit_SSD1306 display(OLED_RESET);

#define BAROMETER_PIN V1
#define TEMPERATURE_PIN V2
#define LIGHT_PIN V3
#define DUST_PIN V4
#define MOISTURE_PIN V5

float temperature;
float pressure;
float voltage;
int moisture;

int measuringPin = A1;
int ledPin = 2;
const int timeMeasuring = 280;
const int timeStabilization = 40;
const int timeSleep = 9680;
float voltageAnalog = 0;
float voltageConversion = 0;
float dustiness = 0;


Adafruit_BMP085_Unified bmp = Adafruit_BMP085_Unified(10180);
const int address = TSL2561_ADDR_FLOAT;
Adafruit_TSL2561_Unified tsl = Adafruit_TSL2561_Unified(address, 12345);

// WiFi network info.
char ssid[] = "SSID";
char wifiPassword[] = "Password";

// Cayenne authentication info. This should be obtained from the Cayenne Dashboard.
char username[] = "Username";
char password[] = "Password";
char clientID[] = "ClientID";

unsigned long lastMillis = 0;


void setup()
{
  Serial.begin(9600);
  Cayenne.begin(username, password, clientID, ssid, wifiPassword);
  pinMode(ledPin,OUTPUT);
  display.begin(SSD1306_SWITCHCAPVCC, 0x3C);
  if (!bmp.begin())
  {
    CAYENNE_LOG("No BMP sensor detected");
    while (1);
  }
  if (!tsl.begin())
  {
    CAYENNE_LOG("No TSL2561 detected");
    while (1);
  }

  tsl.enableAutoRange(true);
  /* Changing the integration time gives you better sensor resolution (402ms = 16-bit data) */
  tsl.setIntegrationTime(TSL2561_INTEGRATIONTIME_13MS);      /* fast but low resolution */
  // tsl.setIntegrationTime(TSL2561_INTEGRATIONTIME_101MS);  /* medium resolution and speed   */
  // tsl.setIntegrationTime(TSL2561_INTEGRATIONTIME_402MS);  /* 16-bit data but slowest conversions */
}

void loop()
{
  Cayenne.loop();

  //Publish data every 10 seconds (10000 milliseconds). Change this value to publish at a different interval.
  if (millis() - lastMillis > 10000) {
    lastMillis = millis();
    //Write data to Cayenne here. This example just sends the current uptime in milliseconds.
   Cayenne.virtualWrite(0, lastMillis);


    sensors_event_t event;
    tsl.getEvent(&event);
    bmp.getPressure(&pressure);
    bmp.getTemperature(&temperature);

    digitalWrite(ledPin,LOW);
    delayMicroseconds(timeMeasuring);
    voltageAnalog = analogRead(measuringPin);
    delayMicroseconds(timeStabilization);
    digitalWrite(ledPin,HIGH);
    delayMicroseconds(timeSleep);

    voltageConversion = voltageAnalog * 2 * (3,3 / 1024.0);
    dustiness = (0.17 * voltageConversion - 0.1)*1000;

    moisture = analogRead(A2);


    Cayenne.luxWrite(LIGHT_PIN, event.light);
    Cayenne.hectoPascalWrite(BAROMETER_PIN, pressure);
    Cayenne.celsiusWrite(TEMPERATURE_PIN, temperature);
    Cayenne.virtualWrite(DUST_PIN, dustiness);
    Cayenne.virtualWrite(MOISTURE_PIN, map(moisture, 1023, 0, 0, 100));

  }
  display.clearDisplay();
  display.setTextColor(WHITE);
  display.setTextSize(1);
  display.setCursor(0, 0);
  display.println(temperature);
  display.setCursor(40, 0);
  display.println("C");
  display.setCursor(0, 10);
  display.println(pressure);
  display.setCursor(55, 10);
  display.println("Pa");
  display.setCursor(0, 20);
  display.println(dustiness);
  display.setCursor(45, 20);
  display.println("ug/m3");
  display.display();


}