Summary of Arduino LED Bar Graph Code
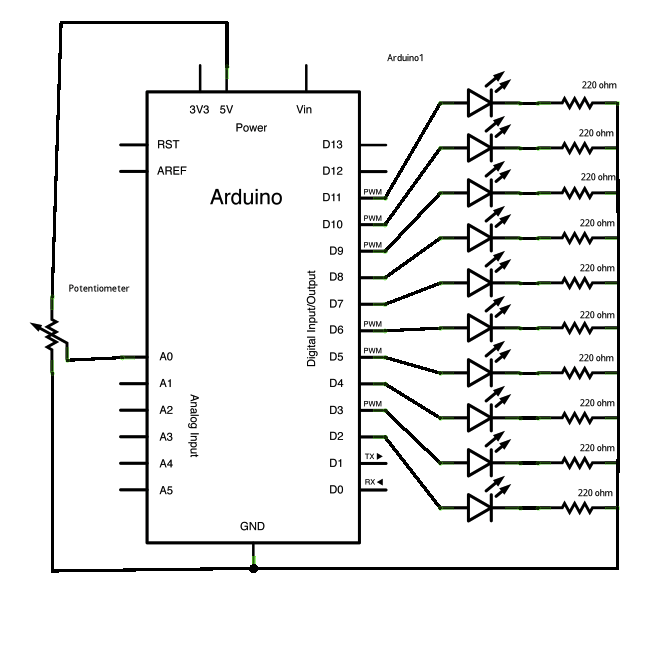
This tutorial shows how to build an LED bar graph: read an analog input, map it to a range equal to the number of LEDs, then use a for loop to turn on LEDs whose index is below the mapped value. It applies to any series of digital outputs. The example uses 10 LEDs (or a single 10-LED bar graph) wired from Arduino pins 2–11 to ground with current-limiting resistors.
Parts used in the LED bar graph:
- Arduino Board
- (1) LED bar graph display or 10 individual LEDs
- (10) 220 ohm resistors
- Hook-up wire
- Breadboard
The bar graph – a series of LEDs in a line, such as you see on an audio display – is a common hardware display for analog sensors.
It’s made up of a series of LEDs in a row, an analog input like a potentiometer, and a little code in between. You can buy multi-LED bar graph displays fairly cheaply, like this one. This tutorial demonstrates how to control a series of LEDs in a row, but can be applied to any series of digital outputs.
This tutorial borrows from the For Loop and Arrays tutorial as well as the Analog Input tutorial.
The sketch works like this: first you read the input. You map the input value to the output range, in this case ten LEDs. Then you set up a for loop to iterate over the outputs. If the output’s number in the series is lower than the mapped input range, you turn it on. If not, you turn it off.
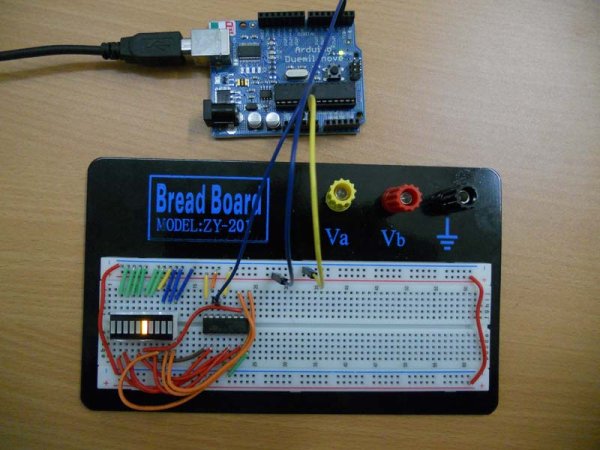
Circuit
Image developed using Fritzing. For more circuit examples, see the Fritzing project page
Schematic:
Code
/*
LED bar graph

Turns on a series of LEDs based on the value of an analog sensor.
This is a simple way to make a bar graph display. Though this graph
uses 10 LEDs, you can use any number by changing the LED count
and the pins in the array.

This method can be used to control any series of digital outputs that
depends on an analog input.

The circuit:
* LEDs from pins 2 through 11 to ground

created 4 Sep 2010
by Tom Igoe

This example code is in the public domain.

http://www.arduino.cc/en/Tutorial/BarGraph
*/
Hardware Required
- Arduino Board
- (1) LED bar graph display or 10 LEDs
- (10) 220 ohm resistors
- hook-up wire
- breadboard
For more detail: Arduino LED Bar Graph Code
- What does the sketch do?
It reads an analog sensor, maps the value to the number of LEDs, and switches each LED on or off based on a for loop comparison. - How many LEDs does the example use?
The example uses 10 LEDs but can be changed by adjusting the LED count and array pins. - Which Arduino pins are used in the example?
The circuit description uses pins 2 through 11 for the LEDs. - Do I need resistors for each LED?
Yes; the hardware list specifies ten 220 ohm resistors for the LEDs. - Can this method control other digital outputs?
Yes; the method can be applied to any series of digital outputs that depend on an analog input. - Where can I find the original example code?
The tutorial references the Arduino LED Bar Graph example available on the Arduino website.