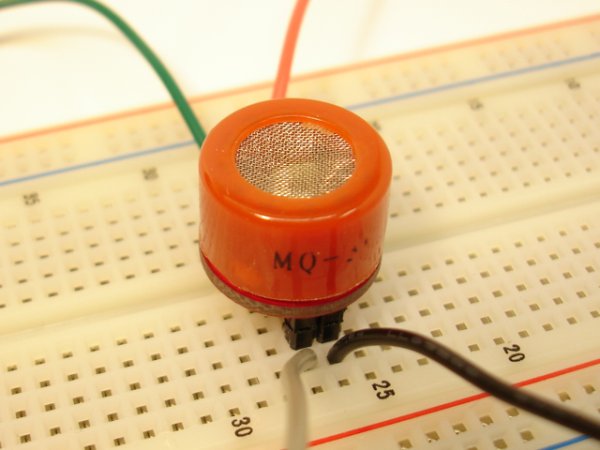
The MQ-3 is an alcohol gas sensor that is available for about $5 from Sparkfun, Seeed Studio, and others. It’s easy to use and has sparked the imagination of anyone who has dreamed of building their own breathalyzer device for measuring the amount of alcohol in the human body. I got an MQ-3 sensor a couple of months ago and have spent a lot of time trying to figure out how to do this. After lots of “data gathering”, I found that this task is not as easy as it sounds.
First of all, don’t try to use the MQ-3 as a way to determine if you are sober enough to drive. If you’ve been drinking, just don’t drive! And if you’ve had a few drinks, don’t do any soldering either.
The Circuit
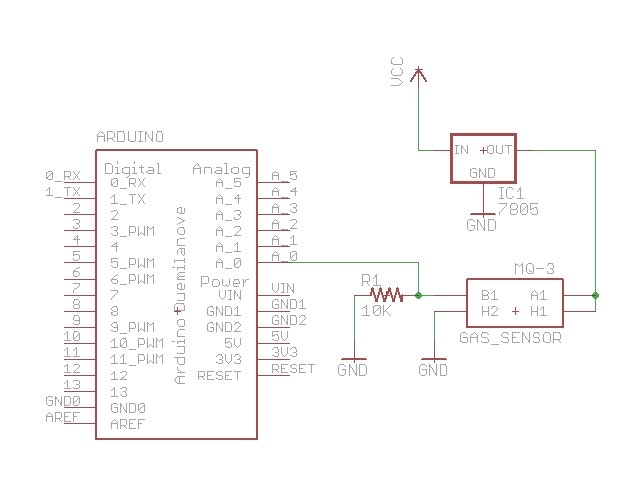
The MQ-3 has a 6 contacts which is confusing, but not as confusing as the MQ-3 datasheet. I also got the Sparkfun breakout PCB for the MQ-3 so it makes the pinout easier to understand. Basically, there is a heater which you power by connecting to VCC and GND. The heater draws about 150mA of current, so I would not power the heater directly from an Arduino board (and certainly not from an output pin). The Arduino voltage regulator can handle 800mA, but you need to consider the power dissipation capability of that voltage regulator, too. I think it’s best to power the heater from an external source, like a regulated 5V power supply or a 7805 voltage regulator.
 The other part of the circuit is essentially a variable resistor inside the sensor. The resistance across an A pin and a B pin varies depending on how much alcohol is in the air in the sensor. The more alcohol, the lower the resistance. We measure alcohol in the breath by measuring this resistance. Instead of measuring the resistance directly, we measure the voltage level at the point between the sensor and a load resistor.The sensor and load resistor form a voltage divider, and the lower the sensor resistance, the higher the voltage reading will be. An Arduino analog input pin is a good way to measure the voltage and gives us a reading between 0 and 1023. Higher values mean more alcohol.
One more caveat that every MQ-3 owner needs to know: the sensor has a 24-48 hour “break in” period. That is, the sensor needs to be turned on for 24-48 hours before the readings become stable.
Here’s a circuit that shows how I connected the MQ-3. I used a 10K ohm load resistor in series with the sensor resistor. The MQ-3 datasheet says to use a 200K ohm resistor, but anyone who’s used this sensor knows that this constrains the measured voltage to a tight, high range. I recommend a 10K ohm resistor. Make sure you connect all the grounds together.
It’s easy to read the analog value from the analog input pin with a very simple Arduino program. I chose to run the Standard Firmata firmware on the Arduino and run a Processing program on my computer to display the values. More on that later.
And Now, Some Math
The good news is that if you know how much alcohol is in your breath, there is a straightforward formula used to calculate your blood alcohol content (BAC). Alcohol content in a volume of breath or blood is expressed as mg/L (milligrams per liter). A 1% blood alcohol content is 10g/L or 10,000mg/L. Since this level would almost certainly be fatal, let’s scale this down from “dead” to “drunk”. A 0.1% BAC is 1000mg/L.
How does this relate to the breath? It turns out that there is a standard conversion from breath alcohol content to BAC that is employed by commercial breathalyzers. Breath and blood alcohol content differ by a factor of 2100; that is, for every mg of alcohol in the breath, there are 2100mg of alcohol in the blood. So, a person with BAC of 0.1% has 1000mg/L of alcohol in their blood and 1000/2100 = 0.4762mg alcohol in their breath. So, our final formula for calculating BAC from the alcohol measured in the breath is:
% BAC = breath mg/L * 0.21
Sensor Calibration Challenges
So, I simply need to use the sensor to determine how many mg/L of alcohol there is in my breath, right? The bad news is that it is very difficult to know how much alcohol is in your breath in terms of mg/L! The poorly written MQ-3 datasheet says to calibrate the sensor by exposing it to a known alcohol gas of 0.4mg/L. From there, you can determine gas alcohol content in terms of mg/L.
But how do I create an air environment with 0.4mg/L alcohol? I could evaporate 0.4mg of ethanol (that’s the type of alcohol we’re talking about here) in a liter of air, but how do I measure out exactly 0.4mg of pure ethanol? I don’t have a source of pure ethanol. I could buy 151 proof Everclear grain alcohol but then would need to account for the different density when measuring this tiny quantity. And there’s the additional complexity in that evaporating aqueous ethanol will alter the humidity, and the sensor readings are sensitive to humidity! This is getting complicated. If were really motivated, I would drive to Wisconsin where I could buy 190 proof (95%) Everclear. Last time I drove to Wisconsin was to buy illegal fireworks, and it seems that my only reason for visiting Wisconsin is to purchase contraband and smuggle it back into Minnesota. But I digress…the bottom line is that calibration according to the MQ-3 datasheet is hard.
Another calibration approach would be to use my breath as a “known” concentration of ethanol after drinking a known quantity of alcoholic beverages. I could drink the right amount of alcohol to give a 0.4mg/L concentraion in my breath and measure the resistance to get my calibration baseline. But this presents problems, too! The sensor calibration depends on 0.4mg/L concentration in “clean air”. What is “clean air”? I think it means air that is devoid of other contaminating gases that affect the sensor, and assumes 21% oxygen concentration and 65% humidity at room temperature. Those conditions are not going to be true in my breath!
My head is spinning, and I haven’t even started drinking yet. In short, I don’t know how to create the right conditions for accurate calibration without a laboratory. Any ideas welcome.
Forget Calibration — Use Correlation
Ultimately, I decided to simply correlate sensor readings with “computed” BAC based on body weight, amount of alcohol consumed, and elapsed time. There are plenty of online charts and calculators that tell you your approximate BAC based on these inputs. Unfortunately, they don’t give the same values for the same input! I used the first link below from Viginia Tech because it was the source of the values cited in the Wikipedia BAC page and everything in Wikipedia is correct, right?
http://www.alcohol.vt.edu/Students/alcoholEffects/estimatingBAC/index.htm
http://www.dot.wisconsin.gov/safety/motorist/drunkdriving/calculator.htm
http://www.bloodalcoholcalculator.org/
http://www.healthstatus.com/cgi-bin/calc/calculator.cgi
http://www.intox.com/wheel/drinkwheel.asp
http://www.1800duilaws.com/dui-resources/BAC-calculator.asp
http://health.discovery.com/tools/calculators/alcohol/alcohol.html
My experimental approach is simply to drink alcohol, compute my BAC according to a chart, and correlate that value to the voltage reading from the Arduino analong input pin. If the sensor is accurate, and if I gather enough data points, I should be able to correlate measured voltage to BAC. This will involve a lot of drinking, night after night. I’m doing this for science. Science!
Sensor Hardware
In order to ensure that I exposed the sensor to a uniform breath sample, I decided to enclose the sensor in a glass chamber. I used a simple glass jar with a plastic lid (it used to hold spices).
For more detail: Arduino Breathalyzer: Calibrating the MQ-3 Alcohol Sensor
