Summary of Arduino based Graph
Summary: This project sends analog readings from Arduino analog input A0 to a computer over the serial port (via USB) and graphs them on the PC (for example using Processing). The Arduino sketch reads A0, prints the value with Serial.println at 9600 baud, and loops with a 2 ms delay.
Parts used in the Graph project:
- Arduino board
- Analog sensor (potentiometer, photocell, FSR, etc.)
- USB cable (for serial connection to computer)
- Computer with Processing or Max/MSP (or other serial-reading software)
This example shows you how to send a byte of data from the Arduino to a personal computer and graph the result. This is called serial communication because the connection appears to both the Arduino and the computer as a serial port, even though it may actually use a USB cable.
You can use the Arduino serial monitor to view the sent data, or it can be read by Processing (see code below), Flash, PD, Max/MSP, etc.
Software Required
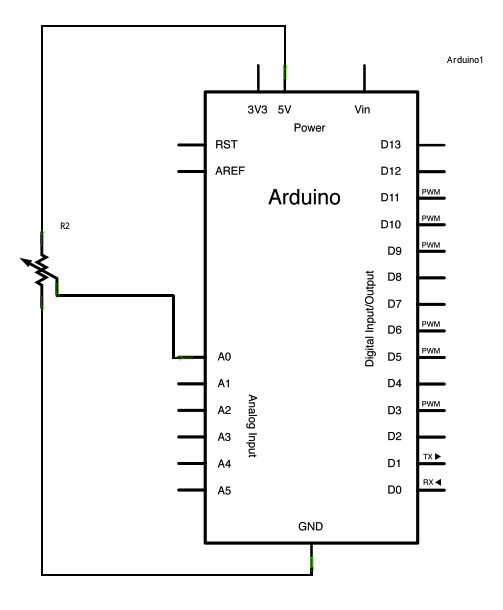
Circuit
Connect a potentiometer or other analog sensor to analog input 0.
image developed using Fritzing. For more circuit examples, see the Fritzing project page
Schematic
Code
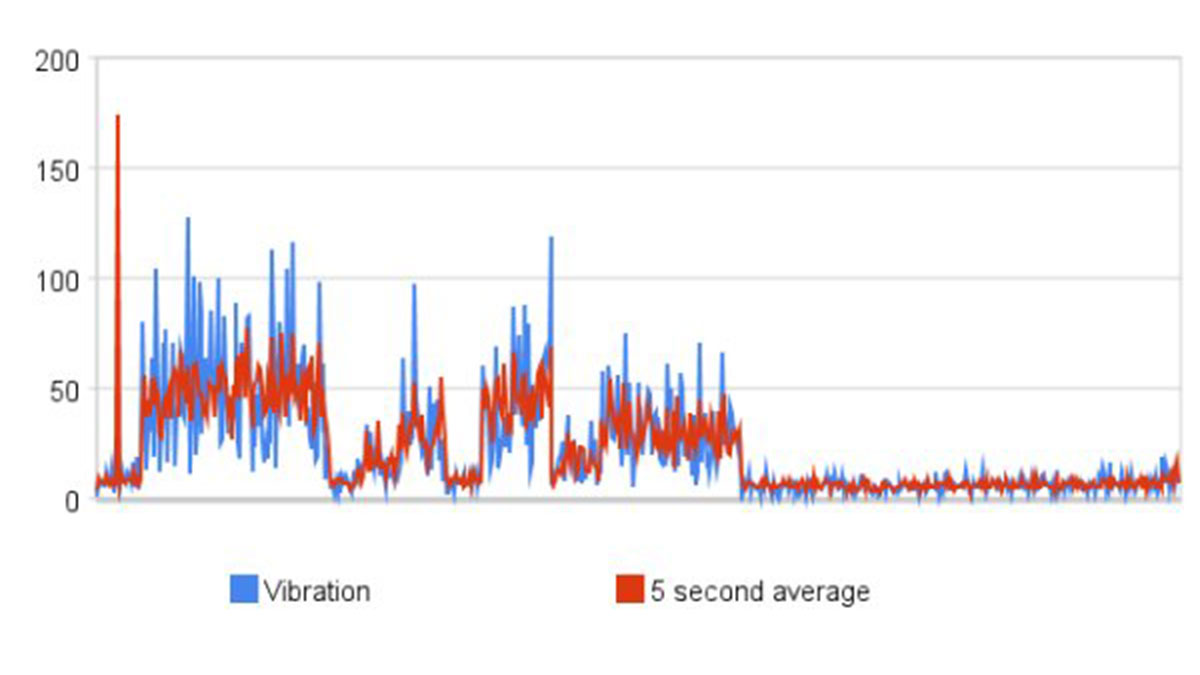
Graph
A simple example of communication from the Arduino board to the computer:
the value of analog input 0 is sent out the serial port. We call this “serial”
communication because the connection appears to both the Arduino and the
computer as a serial port, even though it may actually use
a USB cable. Bytes are sent one after another (serially) from the Arduino
to the computer.
You can use the Arduino serial monitor to view the sent data, or it can
be read by Processing, PD, Max/MSP, or any other program capable of reading
data from a serial port. The Processing code below graphs the data received
so you can see the value of the analog input changing over time.
The circuit:
Any analog input sensor is attached to analog in pin 0.
created 2006
by David A. Mellis
modified 9 Apr 2012
by Tom Igoe and Scott Fitzgerald
This example code is in the public domain.
http://www.arduino.cc/en/Tutorial/Graph
*/
void setup() {
// initialize the serial communication:
Serial.begin(9600);
}
void loop() {
// send the value of analog input 0:
Serial.println(analogRead(A0));
// wait a bit for the analog-to-digital converter
// to stabilize after the last reading:
delay(2);
}
Hardware Required
- Arduino Board
- Analog Sensor (potentiometer, photocell, FSR, etc.)
- What does this example demonstrate?
It demonstrates sending a byte of data from the Arduino to a computer via serial communication and graphing the result on the computer. - How is the analog sensor connected?
The analog sensor is connected to analog input 0 (A0) on the Arduino. - How does the Arduino send the analog reading?
The Arduino reads analogRead(A0) and sends the value using Serial.println. - What baud rate is used for serial communication?
The sketch initializes serial communication at 9600 baud with Serial.begin(9600). - What software can graph the incoming serial data?
Processing or Max/MSP version 5 are mentioned; other programs capable of reading serial data like PD or Flash can also be used. - Is there any delay between readings?
Yes, the code uses delay(2) to wait 2 milliseconds between readings. - Can the Arduino serial monitor view the sent data?
Yes, the Arduino serial monitor can be used to view the sent data. - What kinds of analog sensors are suggested?
Suggested sensors include a potentiometer, photocell, or FSR.