
Summary of Vehicle Telemetry Platform using Arduino
This article describes a DIY vehicle telemetry platform using an Arduino to log engine management data via the OBD-II standard. The system records real-time parameters and GPS location to a USB drive as CSV files, enabling users to create "black box" style flight recorders. It includes scripts to convert data into Google Earth KML files for 3D visualization and generates performance graphs using Google Charts, offering a low-cost alternative to expensive diagnostic consoles.
Parts used in the Vehicle Telemetry Platform:
- Arduino
- OBD-II adapter
- GPS module
- USB host module
- USB memory stick
Ever wondered what goes on under the hood of your car? Wish you could peek inside the engine management system and read values from it? Annoyed that your dashboard displays a cryptic “Check Engine” light (yep, the engine is still there) but gives absolutely no explanation what the problem might be?
You don’t need a US$10,000 diagnostic console or even a laptop computer to get access to useful data from your car. With this project you can connect an Arduino to the engine management system in your car and log data to a CSV file on a USB memory stick in real time as you drive around. By reading and storing engine management system data and combining it with the GPS location you can create your very own “black box” flight data recorder for your car to record a complete snapshot of all engine management parameters at the moment a fault occurs or generate graphs of vehicle performance.
Because this project stores everything in a standard CSV file on a memory stick with a normal FAT filesystem it’s really easy to load up the data on your computer and manipulate it in any way you like. When you get home from a trip you can pull out the memory stick, plug it into a computer, and open it in a spreadsheet or convert it into other formats.

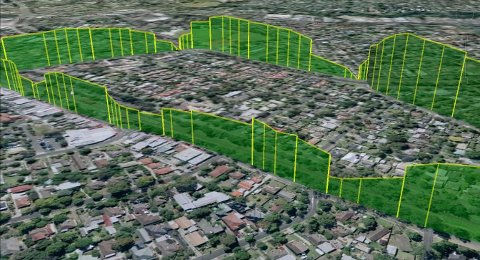
Included in this project is a simple script that converts the raw data into KML, the Google Earth data format, allowing you to create an interactive 3D “fly-around” view of a trip. The screenshot below was generated using Google Earth and shows the vehicle speed plotted as the height of the line. You can clearly see the speed of the car varying as it goes around corners and through intersections.
You can also process the data to generate graphs like the one below that shows vehicle data plotted using Google Charts, and you can clearly see the coolant gradually warming up as the car starts from rest; the accelerating and decelerating during the trip; and finally coming to a halt at its destination. The engine RPM at each part of the trip is also plotted and you can see how it interacts with vehicle speed.
Extracting data from a vehicle’s engine management system may seem like magic but in recent years it has become much easier thanks to a vehicle interface standard called OBD-II, or On-Board Diagnostics version 2. All cars and light trucks sold in the US since 1996 have been required by law to provide an OBD-II interface that provides access to a variety of operational data about the vehicle. Europe followed in 2001 for petrol vehicles and 2003/4 for diesels with the “EOBD” (European OBD) standard which is basically just OBD-II with a different name.
Because car manufacturers try to standardize their production lines, OBD-II vehicles also found their way into many markets outside the US from 1996 onwards. Most Japanese car manufacturers, in particular, deployed OBD-II in other markets very rapidly even when not legally required to do so. The result is that when you take your car to an auto mechanic the first thing they usually do is plug in either a dedicated diagnostic console or a laptop using a special adapter, then run software that interrogates the engine management system to retrieve stored data such as a list of faults it has detected since the last service.
In this project we combine an Arduino with an OBD-II adapter, a GPS module, and a USB host module to create a flexible platform for extracting, logging, and reporting on data from your car. You won’t get Formula-1 style telemetry with thousands of samples per second, but you’ll certainly get more information than an annoying “check engine” light!
Vehicle Telemetry Platform using Arduino
- How can I access useful data from my car without expensive equipment?
You can connect an Arduino to the engine management system to log data to a USB memory stick in real time. - What format is the recorded data saved in?
The project stores everything in a standard CSV file on a memory stick with a normal FAT filesystem. - Can I visualize the trip data in 3D?
Yes, a simple script converts raw data into KML format for an interactive 3D fly-around view in Google Earth. - Does this project work on all cars?
All cars and light trucks sold in the US since 1996 are required to have an OBD-II interface. - What kind of graphs can I generate with the collected data?
You can plot vehicle speed, coolant temperature, acceleration, deceleration, and engine RPM interactions. - How does the system handle fault detection?
The device records a complete snapshot of all engine management parameters at the moment a fault occurs. - Is the European standard compatible with this project?
Yes, the EOBD standard used in Europe is basically just OBD-II with a different name. - Can I manipulate the logged data after the trip?
You can plug the memory stick into a computer and open it in a spreadsheet or convert it into other formats.