Summary of Arduino + Processing: Make a Radar Screen to Visualise Sensor Data from SRF-05 – Part 2: Visualising the Data
The article explains creating a radar screen visualization in Processing to display data from an Arduino-controlled SRF-05 ultrasonic sensor with a servo. It details reading and interpreting sensor and servo values via serial communication, using trigonometry to convert servo angles and distances into XY coordinates for plotting on screen, and continuously drawing the radar sweep and previous sensor readings. The visualization features smooth animations of the sweep direction, data averaging, and motion alerts using Processing's graphics functions and arrays to manage data. The project integrates Arduino sensor data with Processing for real-time top-down radar-like visualization.
Parts used in the Radar Screen Visualisation for SRF-05:
- Arduino microcontroller
- SRF-05 ultrasonic distance sensor
- Servo motor
- Computer running Processing IDE
- Serial communication interface (USB cable)
This is where all the work is done to read an interpret the values from the servo and the sensor. If the readings are to erratic then you won’t have nice shapes. Also if you don’t allow enough time to the signals to be sent back then you’ll get false distance readings. So this code is only as good as your Arduino code and sensor setup.
Took me a few evenings to work this out to get it how I wanted, the hardest bit is the trigonometry involved which isn’t that difficult, everything else is done by loops and a few IF statements. I use the FOR loops alot because the all the elements can be displayed programmatically without having to write each rectangle, cirle and line to the screen with their own statement.
If you’re not familiar with Processing then head over to Processing.org. Processing is a tool/ IDE that lets you program and code graphics and animation, it’s free to use and pretty powerful – best part is it works hand in hand with Arduino in the same C/C++ style of code, letting us take data from Arduino and whatever’s plugged into it and then visualise it on screen, e.g. like a radar screen.
First we have to setup our variables, background and load in the serial port libraries to ensure we can read the data sent by the Arduino. We also have to include a function from the serial library called serialEvent() which listens for data being sent and allows us to read the data easily. We do some easy string work, splitting the serial port lines to get the servo position and sensor value.
Also we can setup the radar screen, drawing the text, measurements and display grid. With processing whats nearest the top of the draw() function is displayed first with everything subsequentally drawn on top of this. So our lines and text will be at the bottom of the function so it will always be visible. To draw the lines and measurements we use a FOR loop. The draw() function draws one frame, so we basically re-draw the frame 180 times – we use a couple of arrays to store the previous values to make it look continuous.
Now that we have those we can then begin to display the values on our screen. We use a FOR loop to loop through each item in our array, newValue and oldValue. These are setup to hold 181 items – 1 item per servo position with 1 extra just in case, we loop through these to constantly display the previous readings – if we were to use the servo position itself to iterate through the array then no previous data would be displayed since the servo position is always changing.
Thoughout we need to calculate the X and Y co-ordinates of each servo position and sensor distance reading. To get these values we use trigonometry using sine and cosine and converting the servo position to a radian using the sensor reading as the distance from the center from which to draw the point. To learn more about this and to save me writing it up check out this tutorial at Processing.org.
The Sketch
Below is the code used to create the radar screen, it has comments to help explain. Everything used is an in built function of the Processing language and you can find the reference for the functions that I use in the reference section on the Processing.org website. So methods such as fill(), stroke(), rect(), line() etc…
/*
luckylarry.co.uk
Radar Screen Visualisation for SRF-05
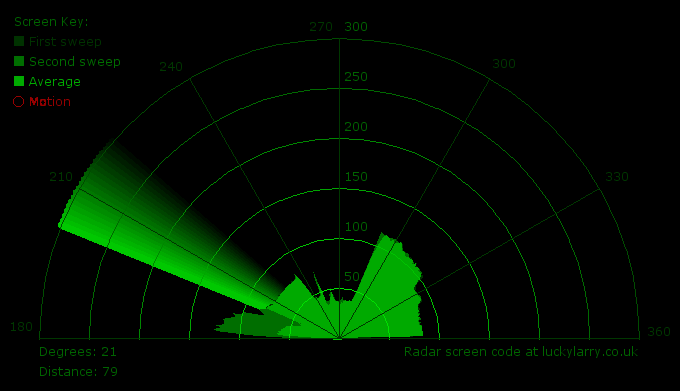
Maps out an area of what the SRF-05 sees from a top down view.
Takes and displays 2 readings, one left to right and one right to left.
Displays an average of the 2 readings
Displays motion alert if there is a large difference between the 2 values.
*/
import processing.serial.*; // import serial library
Serial myPort; // declare a serial port
float x, y; // variable to store x and y co-ordinates for vertices
int radius = 350; // set the radius of objects
int w = 300; // set an arbitary width value
int degree = 0; // servo position in degrees
int value = 0; // value from sensor
int motion = 0; // value to store which way the servo is panning
int[] newValue = new int[181]; // create an array to store each new sensor value for each servo position
int[] oldValue = new int[181]; // create an array to store the previous values.
PFont myFont; // setup fonts in Processing
int radarDist = 0; // set value to configure Radar distance labels
int firstRun = 0; // value to ignore triggering motion on the first 2 servo sweeps
/* create background and serial buffer */
void setup(){
// setup the background size, colour and font.
size(750, 450);
background (0); // 0 = black
myFont = createFont("verdana", 12);
textFont(myFont);
// setup the serial port and buffer
myPort = new Serial(this, Serial.list()[1], 9600);
myPort.bufferUntil('n');
}
/* draw the screen */
void draw(){
fill(0); // set the following shapes to be black
noStroke(); // set the following shapes to have no outline
ellipse(radius, radius, 750, 750); // draw a circle with a width/ height = 750 with its center position (x and y) set by the radius
rectMode(CENTER); // set the following rectangle to be drawn around its center
rect(350,402,800,100); // draw rectangle (x, y, width, height)
if (degree >= 179) { // if at the far right then set motion = 1/ true we're about to go right to left
motion = 1; // this changes the animation to run right to left
}
if (degree <= 1) { // if servo at 0 degrees then we're about to go left to right
motion = 0; // this sets the animation to run left to right
}
/* setup the radar sweep */
/*
We use trigonmetry to create points around a circle.
So the radius plus the cosine of the servo position converted to radians
Since radians 0 start at 90 degrees we add 180 to make it start from the left
Adding +1 (i) each time through the loops to move 1 degree matching the one degree of servo movement
cos is for the x left to right value and sin calculates the y value
since its a circle we plot our lines and vertices around the start point for everything will always be the center.
*/
strokeWeight(7); // set the thickness of the lines
if (motion == 0) { // if going left to right
for (int i = 0; i <= 20; i++) { // draw 20 lines with fading colour each 1 degree further round than the last
stroke(0, (10*i), 0); // set the stroke colour (Red, Green, Blue) base it on the the value of i
line(radius, radius, radius + cos(radians(degree+(180+i)))*w, radius + sin(radians(degree+(180+i)))*w); // line(start x, start y, end x, end y)
}
} else { // if going right to left
for (int i = 20; i >= 0; i--) { // draw 20 lines with fading colour
stroke(0,200-(10*i), 0); // using standard RGB values, each between 0 and 255
line(radius, radius, radius + cos(radians(degree+(180+i)))*w, radius + sin(radians(degree+(180+i)))*w);
}
For more detail: Arduino + Processing: Make a Radar Screen to Visualise Sensor Data from SRF-05 – Part 2: Visualising the Data