An easy-to-build and low-cost water quality monitor.
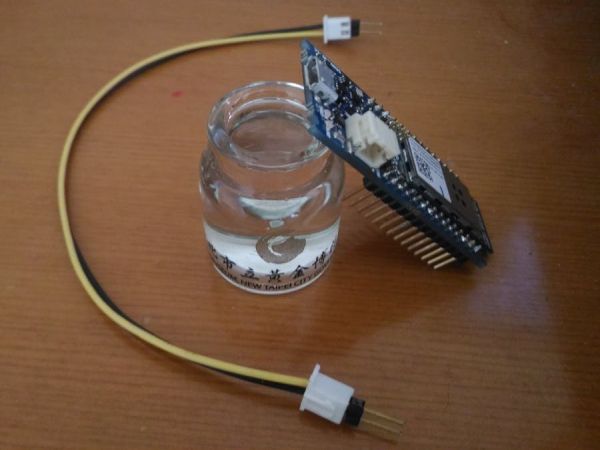
Things used in this project
Story
After I saw TDS measure circuit I am thinking if it possible use few parts to complete measure.
Here I try as below.
Hardware
- Arduino MKR1000 * 1
- 4.7k ohm resistor * 2
- Dupont Line * 3
- 2P 2.54mm connector Line * 1
- 2.54mm gold plated pin 2P * 2
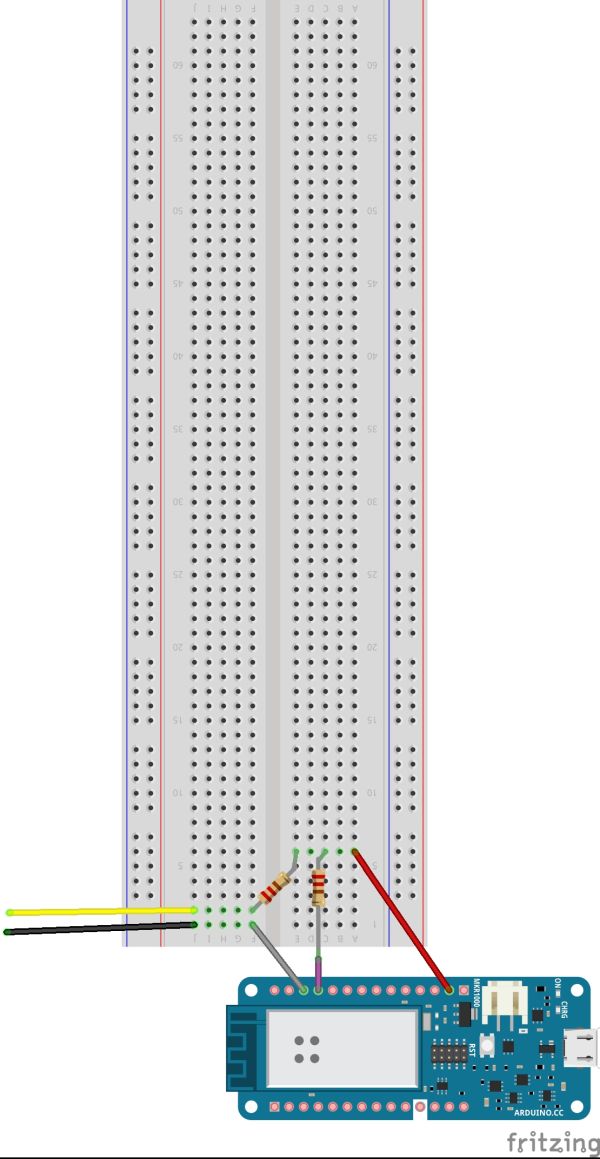
Connection
See pictures and caption below.
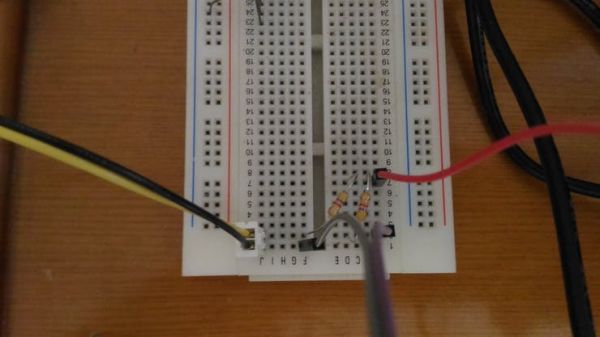
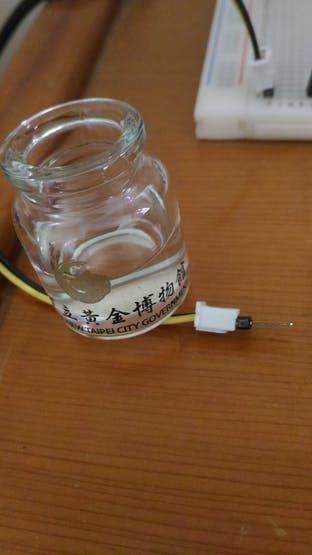
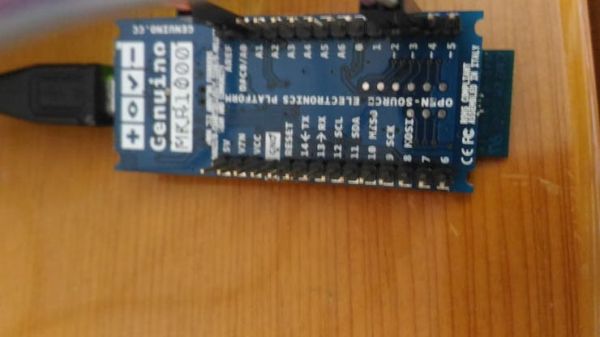 connect MKR1000’s A0/D2/D3 with Dupont Line
Software
- Program with Arduino IDE and modify form example “Analog Input”
void loop() {
 // start
 digitalWrite(ledPin, HIGH);
 //port LL
 digitalWrite(port1, LOW);
 digitalWrite(port2, LOW);
 sensorValue1 = analogRead(sensorPin);
 delay(delaytime);
 //port LH
 digitalWrite(port1, LOW);
 digitalWrite(port2, HIGH);
 sensorValue2 = analogRead(sensorPin);
 delay(delaytime);
 digitalWrite(ledPin, LOW);
 //port HH
 digitalWrite(port1, HIGH);
 digitalWrite(port2, HIGH);
 sensorValue3 = analogRead(sensorPin);
 delay(delaytime);
 //port HL
 digitalWrite(port1, HIGH);
 digitalWrite(port2, LOW);
 sensorValue4 = analogRead(sensorPin);
 delay(delaytime);
 Serial.print(sensorValue1);
 Serial.print(",");
 Serial.print(sensorValue2);
 Serial.print(",");
 Serial.print(sensorValue3);
 Serial.print(",");
 Serial.print(sensorValue4);
 Serial.println();
}
Result
Here I have one bottle clean water and one bottle non-pure water.
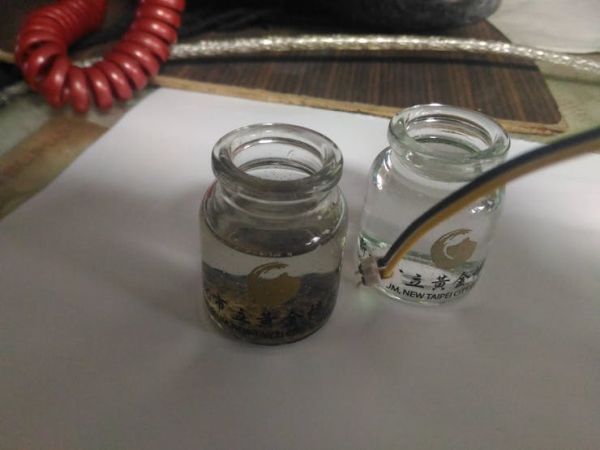
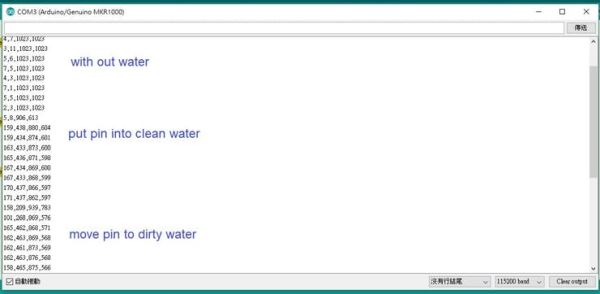
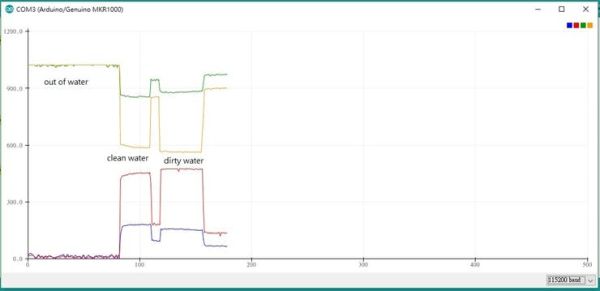
I collected three different data comparisons
1. Gold plated pin is out of water
2. Pin in clean water
3. Pin in non-pure water
Analysis
When pin in clean water, data is
“159, 434, 874, 601”
“163, 433, 873, 600”
“165, 436, 871, 598”
When pin in non-pure water data is
“159, 462, 876, 566”
“159, 465, 878, 564”
“158, 463, 878, 565”
Here the 1st and 3rd are close at each sample, 2nd and 4th have 25~30 count gap.
It is exactly what I want “can be used to distinguish water quality.”
Next step I need a TDS meter as standard reference.
=================================================================
update 2018/5/13
Today I increase the number of ADC sampling and use my home’s 4 different water test again.
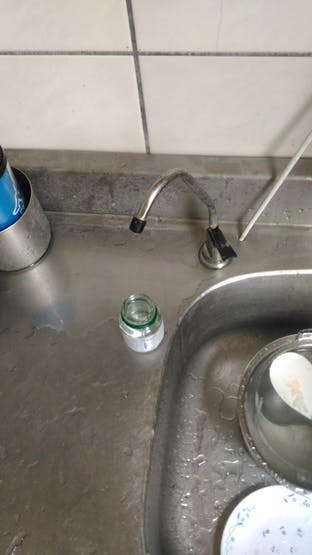
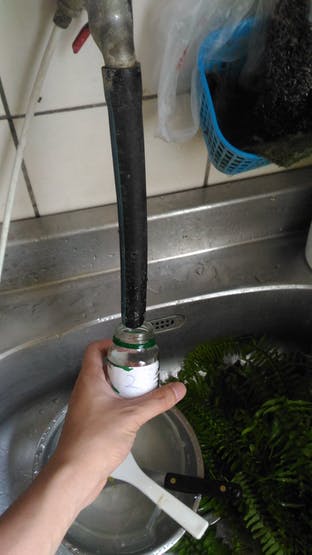
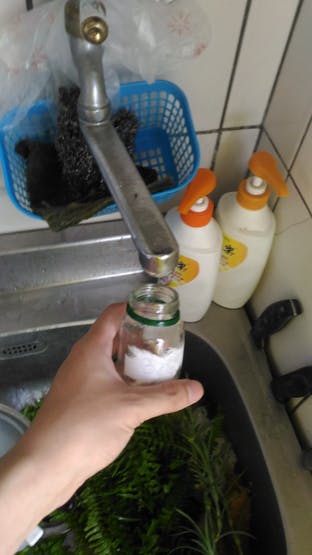 Tap water
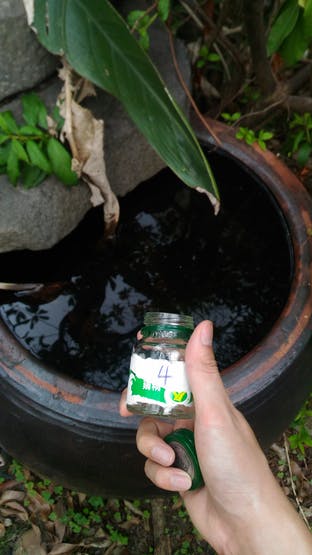
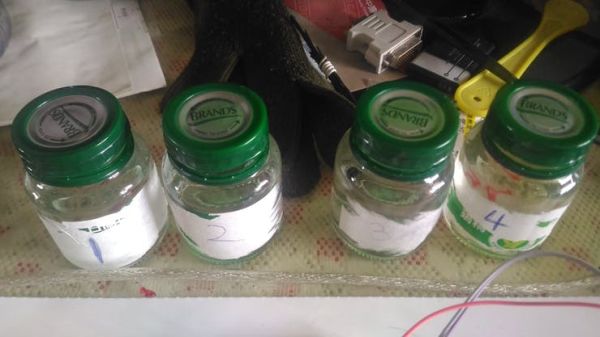
Bottle 1 is RO water.
Bottle 2 is groundwater.
Bottle 3 is tap water.
Bottle 4 is water outdoor.
Test video as below
it seems that RO water ADC value have very different with other.
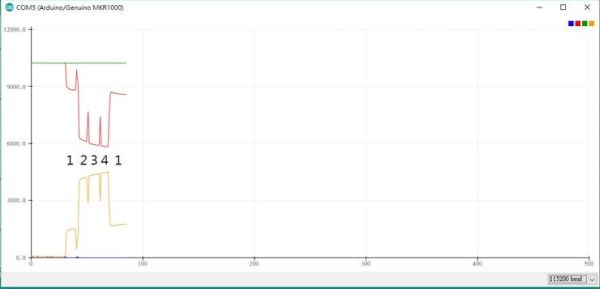
I also add WiFi-web-server function to show data on explorer.
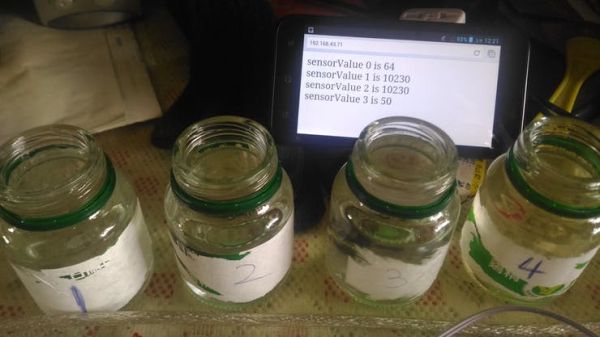
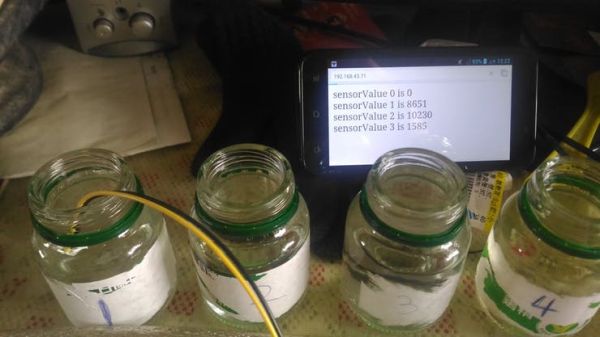
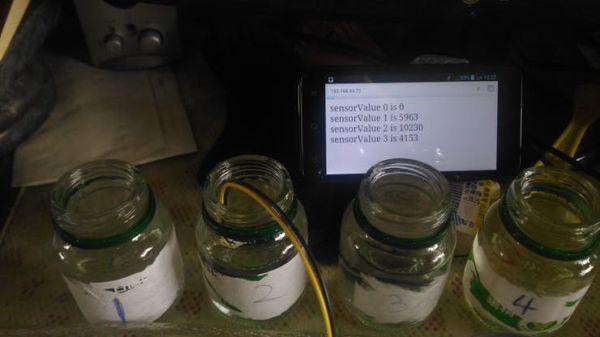
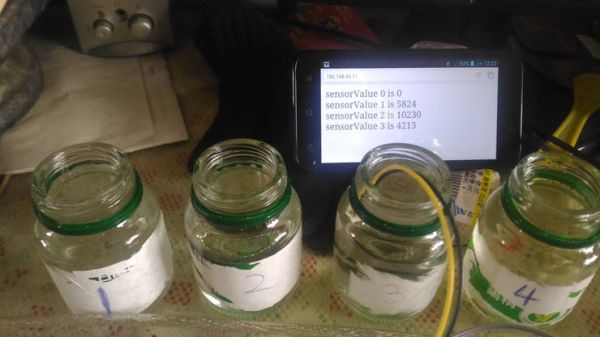
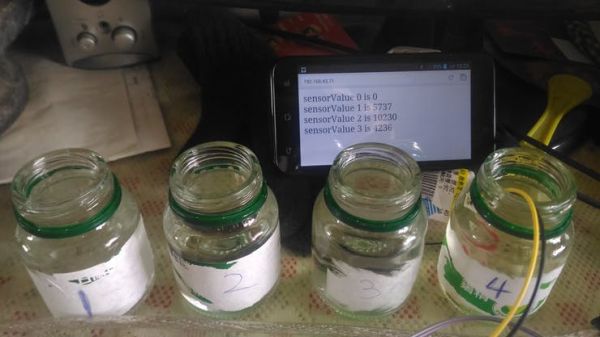
Here the sensorValue number mean
sensorValue0 port voltage is Low Low
sensorValue1 port voltage is Low High
sensorValue2 port voltage is High High
sensorValue3 port voltage is High Low
But since I change the pin the value order ( 2nd and 4th ) are not the same with first time test.
Schematics
Source : Simple Water Quality Analysis


and print it for analyze