Summary of Read analog data directly in Processing using arduino
This article outlines a method to visualize analog sensor data in Processing using an Arduino. It covers preparing the environment by uploading standard Firmata and installing libraries, building circuits with specific sensors like accelerometers, potentiometers, or photocells, and calibrating the code range. The guide provides a sample Processing sketch to read values from pin A0 and map them to screen coordinates for visual representation.
Parts used in the Analog Sensor Data Visualization Project:
- Arduino board
- Prototype electronic boards
- Photocell sensor
- Accelerometer sensor
- Potentiometer sensor
- Processing software
- Arduino IDE
This instructable presents a fast an easy way to use data received from an analog sensor in Processing. You will learn to utilize the Arduino and prototype electronic boards to read meaningful data from the environment. The sensors can be affected by the light, the orientation, or a user’s physical input. For this matter we will use photocell, accelerometer, and potentiometer.

Step 1: Preparation steps
1. Upload the “standardFirmata” example from the Arduino IDE in your Arduino board. If you are using Arduino UNO, there is a standard firmata for UNO.
2. Install Arduino library for processing in your libraries folder in the processing sketchbook
For a detailed instructable for this
Step 2: Build the circuits
Choose one of the circuits from the images below depending on your preferred sensor:
1. Accelerometer
2. Potentiometer
3. Photocell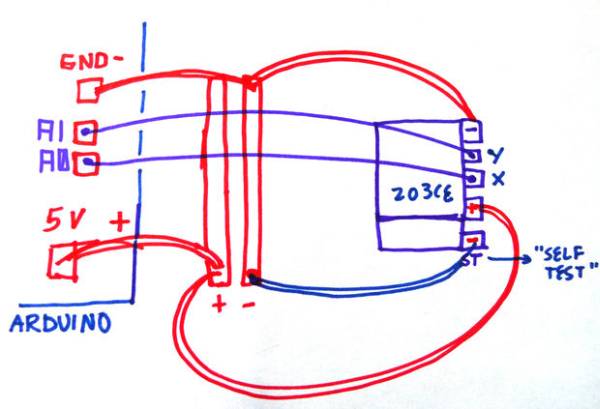
Step 3: Test the code and calibrate sensor range
1.Use the following code in processing:
import processing.serial.*;
import cc.arduino.*;
Arduino arduino; //creates arduino object
color back = color(64, 218, 255); //variables for the 2 colors
int sensor= 0;
int read;
float value;
void setup() {
size(800, 600);
arduino = new Arduino(this, Arduino.list()[0], 57600); //sets up arduino
arduino.pinMode(sensor, Arduino.INPUT);//setup pins to be input (A0 =0?)
background(back);
}
void draw() {
read=arduino.analogRead(sensor);
background(back);
println (read);
value=map(read, 0, 680, 0, width); //use to callibrate
ellipse(value, 300,30, 30);
}
2. Use the “println” command to output your sensor’s minimum and maximum values. They will be different depending on the context. Plug the min and max values in your map() function.
For more detail: Read analog data directly in Processing
- How do I prepare my Arduino board?
Upload the standardFirmata example from the Arduino IDE to your board. - Can I use different types of sensors?
Yes, you can choose between an accelerometer, potentiometer, or photocell. - What is the first step in building the circuit?
Choose one of the provided circuit images based on your preferred sensor. - How do I calibrate the sensor range in the code?
Use the println command to find minimum and maximum values, then plug them into the map function. - Which library must be installed in Processing?
You must install the Arduino library for Processing in your libraries folder. - Does the sensor output depend on the environment?
Yes, sensors can be affected by light, orientation, or user physical input. - What does the map function do in the provided code?
It maps the raw sensor reading from 0 to 680 to the width of the screen. - How is the sensor data visualized?
The data is visualized as an ellipse whose position changes based on the mapped value.