Summary of PC-based Oscilloscope Using Arduino
This article details building a low-cost PC-based oscilloscope using an Arduino board and a Windows application. The system captures signals up to 5kHz by reading the ADC via pin A0, transmitting data over USB at 115200 baud, and visualizing waveforms on a computer screen using NI LabWindows software.
Parts used in the PC-based Oscilloscope:
- Arduino board (with AVR microcontroller)
- PC or laptop running Windows
- USB cable
- Switching diodes (D1 and D2, e.g., 1N4148)
- 10-kilo-ohm resistor
- Arduino sketch (pcscope.ino)
- PC software executable (PCScope.exe)

Oscilloscopes are an essential tool for electronics hobbyists and professionals to verify that their designs would work as expected. PC-based oscilloscopes score over standalone oscilloscopes due to their compact size, low cost and ability to do offline analysis.
Here we describe how you can make your own oscilloscope at a very low cost using your PC and an Arduino board as the hardware for signal acquisition. You can use this oscilloscope to capture frequency signals up to 5kHz. The Arduino board, the heart of the oscilloscope, reads the values from its inbuilt analogue-to-digital converter (ADC) and pushes these to the PC via USB port. We have provided here an Arduino sketch, which you can compile and load directly to the Arduino. You also need to install an executable file or application in your Windows PC. This application works as the front-end to plot input signals as waveforms on your computer screen.
The Arduino board consists of Atmel’s AVR microcontroller, which can be 8-, 16- or 32-bit based on the type of the board. For this project you can use any variant of the Arduino as hardware. The AVR microcontroller has an inbuilt ADC. In the project we use pin A0 to capture the input signal. The captured input signal is fed to UART via UART-USB converter in the Arduino to the PC. A virtual COM port is created by Windows whenever the Arduino connects to the PC. A Windows-based application developed using NI LabWindows opens up the virtual COM port and starts plotting signals visually using Graph libraries.
The sampling speed of the oscilloscope is limited by the baud rate of the UART. The Arduino sketch is coded to read the ADC using ISR, and the UART baud rate is configured at 115200, which sends data at 85µs intervals. This gives an effective sampling rate of 12kSa/s.
Construction
The PC scope set-up is quite simple and straightforward as shown in Fig. 1. The Arduino board connects to your laptop or PC via the USB cable. Any external power supply for the board is not required as the board is powered by the USB only. Connect switching diodes (D1 and D2) as input protection circuit to pin A0 of the Arduino’s ADC. You need Arduino sketch (pcscope.ino) and PC software or executable file (PCScope.exe) in order to use this circuit. Install PCScope.exe program (developed by author) in your Windows PC and open the application. Next, open the Arduino sketch from Arduino IDE and compile the sketch. Connect the Arduino board to the PC and flash the sketch into the microcontroller on the Arduino board.
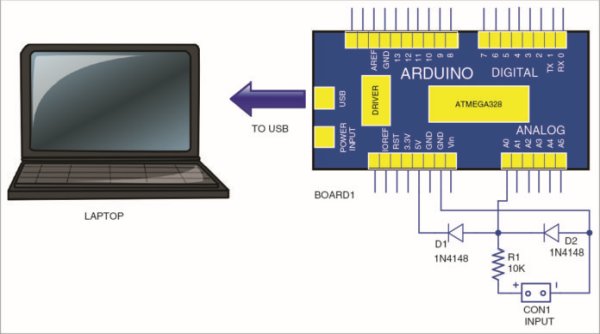
Circuit of the PC-based oscilloscope using Arduino
The ADC of Arduino can measure voltages up to 5V. So it is advisable to add a small protection circuit to limit the input voltage to 5V and clamp the negative voltage. A low-power, fast-switching diode like 1N4148 can be used to protect the input pin. Connect a 10-kilo-ohm resistor in series with the input. It will work as a current limiter in case the input goes beyond 5V. Additional voltage dividers can be used in case you need to measure voltages higher than 5V.
Software
Arduino sketch. The sampling rate of this PC scope application is limited by the rate at which the data is sent to the PC. Baud rate of 115000 gives time interval of around 85 µs. It is important to get the ADC signals much before this time to get reliable data plotting. The sketch reads pin A0 of Board1 and sends to UART at 115200 baud rate. At this speed, bytes of the input are pushed at time intervals of around 85µs.
By default, the ADC configuration of the Arduino gives samples every 116µs. So here the ADC is configured with additional lines of code to get samples faster than 85µs by setting the prescaler to 16. With this, you get ADC conversion every 20µs, which is much faster than the UART data transfer rate.
Download source code
PC software. As stated earlier, the front-end PC software for signal acquisition and processing is developed using NI LabWindows. The serial port data is captured through Arduino at regular time intervals and plotted as a graph on the screen using the Plot function library. The display points along X-axis are calculated based on the user-defined time scale. The Y-axis range is set using the voltage selection control.
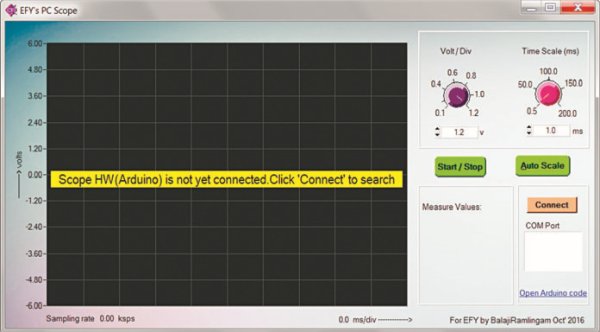
Message on the screen when the PC-based scope is run for the first time
Testing
After installing the PC scope application, click ‘Connect’ button on your PC screen to connect to the Arduino board (Fig. 2). When the board gets connected to your PC, you will get a confirmation message for three seconds as shown in Fig. 3.
Read More Detail:PC-based Oscilloscope Using Arduino
- What is the maximum frequency this oscilloscope can capture?
The device can capture frequency signals up to 5kHz. - How is the input signal connected to the Arduino?
The input signal is fed to pin A0 of the Arduino's ADC after passing through protection diodes and a series resistor. - Does the Arduino board require an external power supply for this project?
No, the board is powered directly by the USB connection from the PC. - What baud rate is configured for the UART communication?
The UART baud rate is configured at 115200. - Which software is used to develop the front-end PC application?
The front-end PC software was developed using NI LabWindows. - How does the system achieve a sampling interval faster than the default ADC time?
The prescaler is set to 16 in the code to allow ADC conversion every 20µs instead of the default 116µs. - What happens when the user clicks the Connect button in the software?
A confirmation message appears on the screen for three seconds once the board connects successfully. - Can this setup measure voltages higher than 5V?
Yes, additional voltage dividers can be used if measurements above 5V are required.