Summary of NOBLE GRAPHS: DISPLAYING DATA WITH NEON LIKE ITS 1972
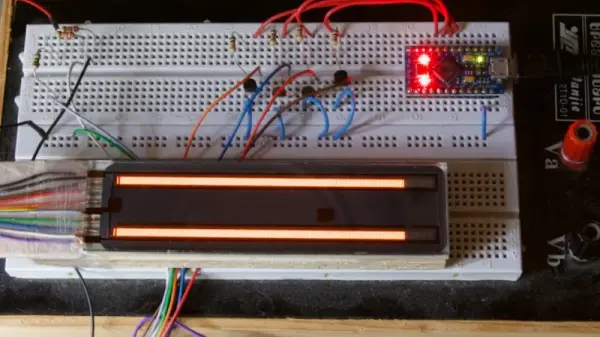
Aart Schipper discovered a pair of Burroughs Bar Graph Glow-Transfer Displays, neon-based meters with two 201-segment bars (200 controllable segments plus a pilot segment each). They use a Glow-Transfer Principle where each neon segment helps ignite its neighbor, driven by a three-phase clock and comparators to represent an analog signal per bar. These vintage neon bar graphs were often used as audio meters and evoke a similar aesthetic to Nixie tubes.
Parts used in the Burroughs Bar Graph Glow-Transfer Display project:
- Burroughs Bar Graph Glow-Transfer Display (pair)
- Neon segment bars (201 segments per bar)
- Three-phase clock circuitry
- Comparators for signal driving
- Analog input signals (one per bar)
In the days before every piece of equipment was an internet-connected box with an OLED display, engineers had to be a bit more creative with how they chose to communicate information to the user. Indicator lights, analog meters, and even Nixie tubes are just a few of the many methods employed, and are still in use today. There are, however, some more obscure (and arguably way cooler) indicators that have been lost to time.
Don’t get us wrong, the warm, comforting glow of Nixie tubes will always have a special place in our hearts, but neon bar graphs are just hard to beat. The two do have a similar aesthetic though, so here’s hoping we see them used together in a project soon.
Source: NOBLE GRAPHS: DISPLAYING DATA WITH NEON LIKE ITS 1972
- What did Aart Schipper find in his father’s shed?
He found a pair of Burroughs Bar Graph Glow-Transfer Displays. - How many segments does each bar have?
Each bar has 201 neon segments, with 200 controllable segments and one always-illuminated pilot segment. - What is the purpose of the first segment on each bar?
The first segment acts as a pilot light and is always illuminated. - How does each segment activate its neighbor?
Each segment is used to ignite its neighboring segment via the Glow-Transfer Principle. - How are the bars driven with relatively few wires?
By using a three-phase clock and comparators, each bar is controlled by one analog signal, keeping wire count low. - What were these neon bar graphs often used for?
They were often used as audio meters, showing left and right signals. - How do neon bar graphs compare aesthetically to Nixie tubes?
Neon bar graphs have a warm glow and a similar aesthetic to Nixie tubes.