Summary of MKR1000 to Initial State DHT Visulaizations
This tutorial demonstrates using an Arduino MKR1000 to upload DHT11 sensor data (temperature, humidity, and heat index) to InitialState.com for cloud visualization. The process involves registering on InitialState, obtaining API keys, wiring the hardware, and uploading a modified Arduino sketch that formats HTTP requests to send real-time data to the platform's free tier.
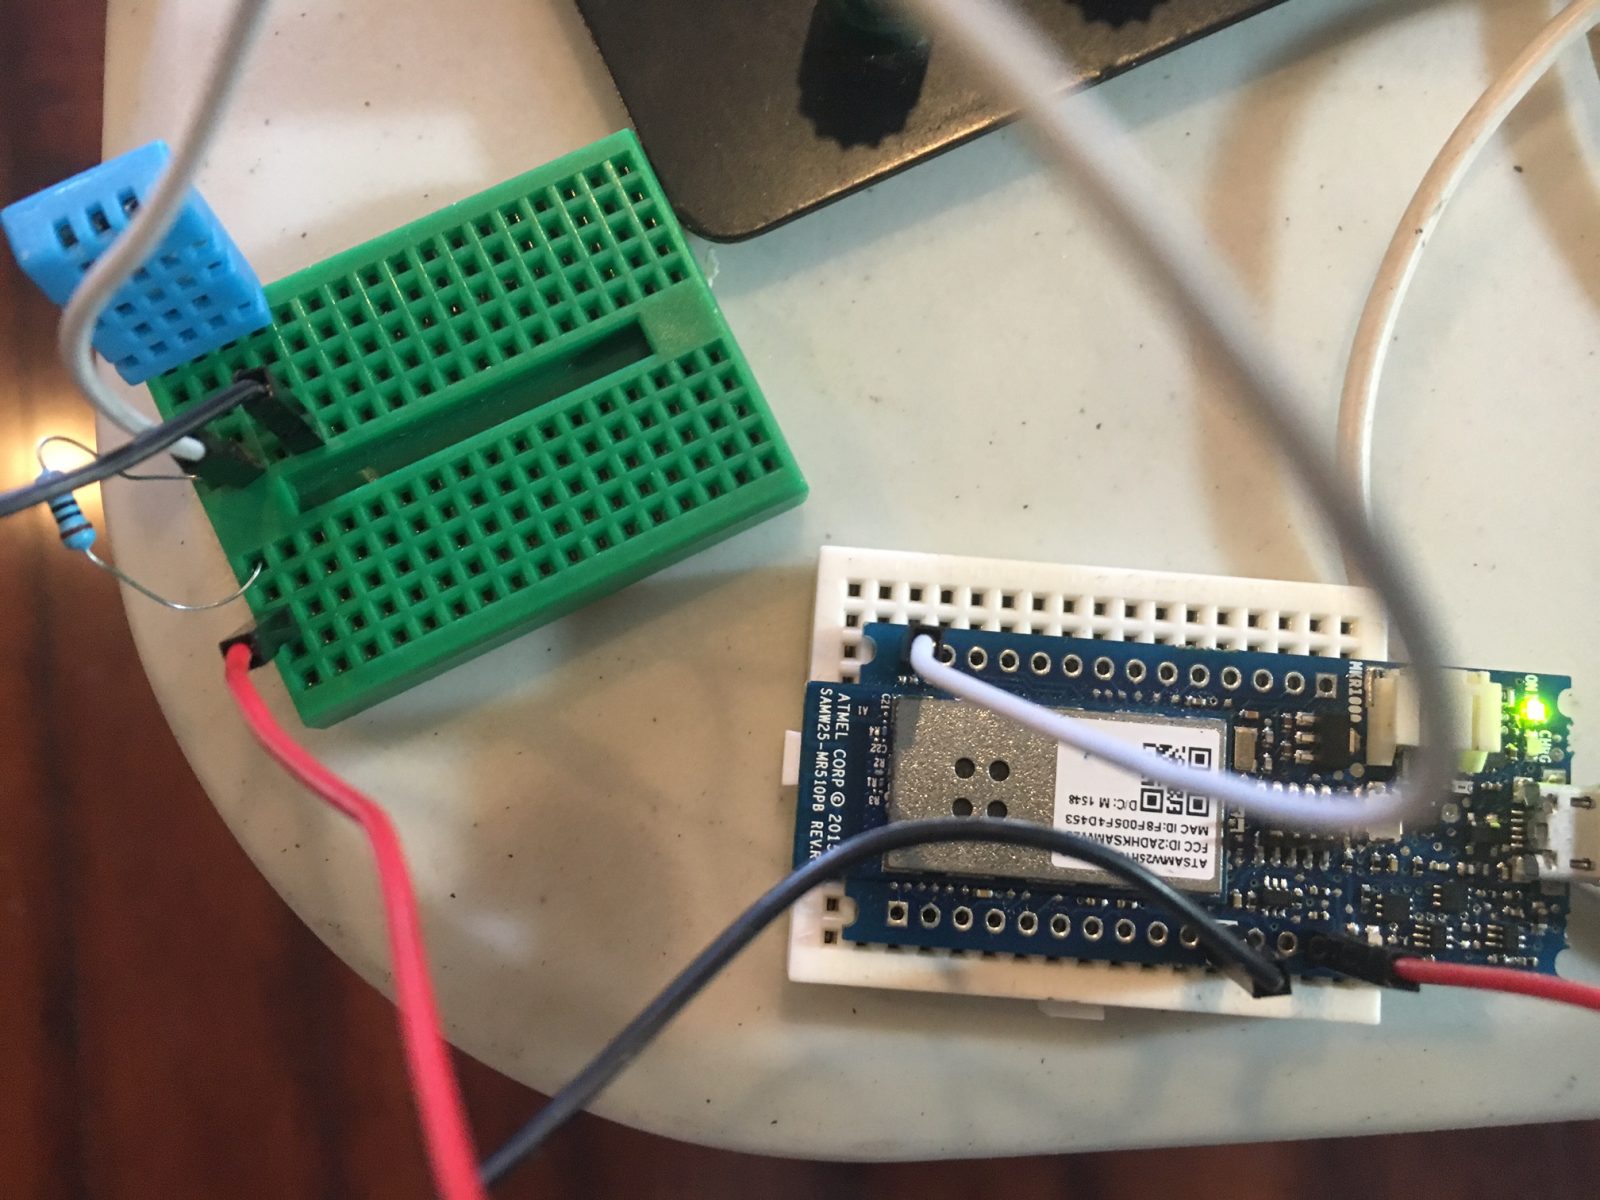
Parts used in the Arduino MKR1000 to InitialState.com Project:
- Arduino MKR1000
- DHT11 Temperature & Humidity Sensor (4 pins)
- Breadboard (generic)
- Jumper wires (generic)
- USB-A to Micro-USB Cable
This demonstrates how to use your Arduino MKR1000 to connect to InitialState.com to produce colorful visualizations of your sensor data.
Things used in this project
Hardware components |
||||||
 |
|
× | 1 | |||
 |
|
× | 1 | |||
 |
|
× | 1 | |||
 |
|
× | 1 | |||
 |
|
× | 1 | |||
Software apps and online services |
||||||
 |
|
|||||
|
||||||
Story
This tutorial will explain how to upload sensor data from the ubiquitous DHT sensor, attached to the Arduino MKR1000 WiFi device, to the Initial State website. Initial State is a website similar to ThingSpeak.com (see my other tutorial on Hackster.io). InitialState.com has both paid and free tier accounts available. I will be using the free tier in this demonstration to show how to get graphs, charts and numeric data logging all from the Initial State website. Like most similar free cloud IoT data sites for makers and hacksters, the code we use is very similar between these websites. Where we see the fundamental difference is in how the RESTful API string is constructed, concatenated, and formatted to allow the communication between the embedded device and IoT website to concur successfully. These websites tend to be very strict on how to properly construct the API REST strings to function successfully.
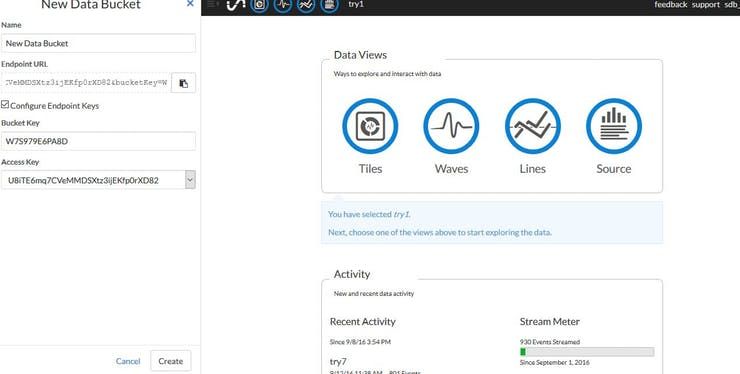
Our first step in this process is to register for a free account on InitialState.com and create a new visualization. You can create the visualization but clicking the cloud icon. You should name your visualization anything you like.
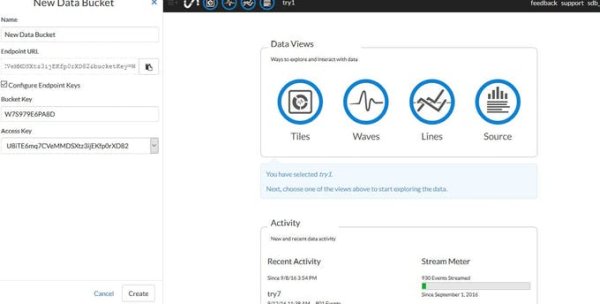
After creating our new visualization we will need to copy our API key(called Access key here) and Bucket Key. Both these are provided by alphanumeric digits. We can rename our Bucket Key to anything with like, however each visualization needs a unique Bucket Key name. You will only have one API key throughout all your visualizations, this is used to identify your account not your specific visualization (that’s what the bucket key is used for). If you forget your Access/API key you can generate a new one at any time linked to your account.
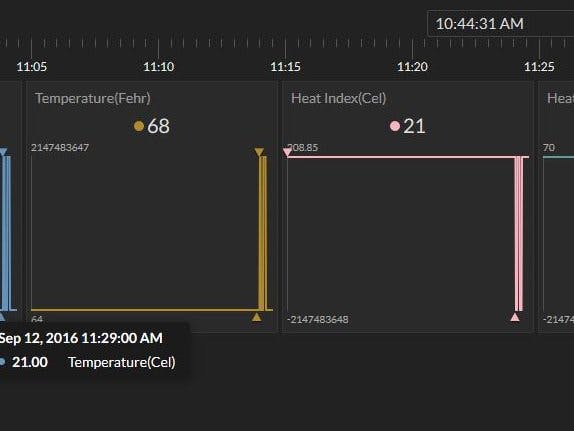
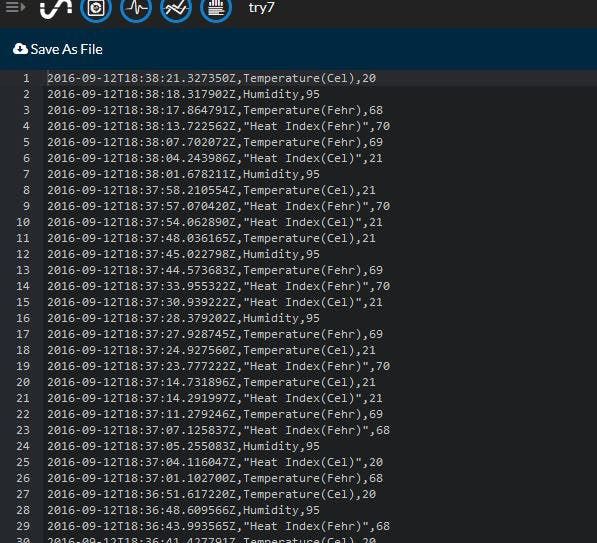
From this point we can now add new tiles with custom parameters to our visualizations. We also have default line charts and wave charts available for every visualizations as well as a simple data logger for raw numbers which can be downloaded to your computer. Overall it is an impressive free package for data logging over the cloud. On the free tier your data is only saved for 24 hours.
Now that we established our free account, and customized our graphs and charts to output visualizations how we like, we can use our MKR1000 to upload data to our account.
Remember to save your Bucket Key (Default or renamed) and Access Key to use in the Arduino MKR1000 sketch. Once you have successfully connected to Initial State in the cloud you will see your graphs, charts, and other visualizations getting updated with your uploaded sensor data.
I will try to do the same tutorial for the Intel Edison and ESP8266. My code is based upon a modified example for the Ethernet Shield example provided by Initial State, RChloe and Gaetano Carlucci. I also added section to use DHT output and WiFi info but it is easy to alter for most any sensor.
Schematics
Wiring Diagram
Code
- What is the primary function of this project?
To upload sensor data from a DHT sensor attached to an Arduino MKR1000 WiFi device to the Initial State website. - How do you create a new visualization on Initial State?
You can create the visualization by clicking the cloud icon on the website. - Can I rename my Bucket Key?
Yes, you can rename your Bucket Key to anything, but each visualization needs a unique name. - Does the free tier save data indefinitely?
No, on the free tier your data is only saved for 24 hours. - Which libraries must be installed before running the code?
You need to download and install the WiFi101 and Adafruit DHT libraries. - How many signals are configured in the example sketch?
The example uses 5 data sensors for signals including Humidity, Temperature, and Heat Index. - What happens if the DHT sensor read fails?
The code prints Failed to read from DHT sensor! to the serial port and returns to try again. - Is HTTPS supported by the ESP8266 in this context?
No, HTTPS cannot be handled by the ESP8266, so the code uses insecure-groker.initialstate.com.