
Presented here is a IoT enabled air pollution meter to monitor air quality on your smartphone using Blynk application and Arduino board. Blynk is an Internet of Things (IoT) platform to control Arduino, Raspberry Pi and the like over the Internet. In this project Blynk provides a digital dashboard on your smartphone that displays real-time air quality readings for the immediate surroundings.
Blynk is not meant for a specific board or shield. It will get you online and ready for the IoT, irrespective of whether Arduino or Raspberry Pi is linked to the Internet over Wi-Fi, Ethernet or an ESP8266 chip.
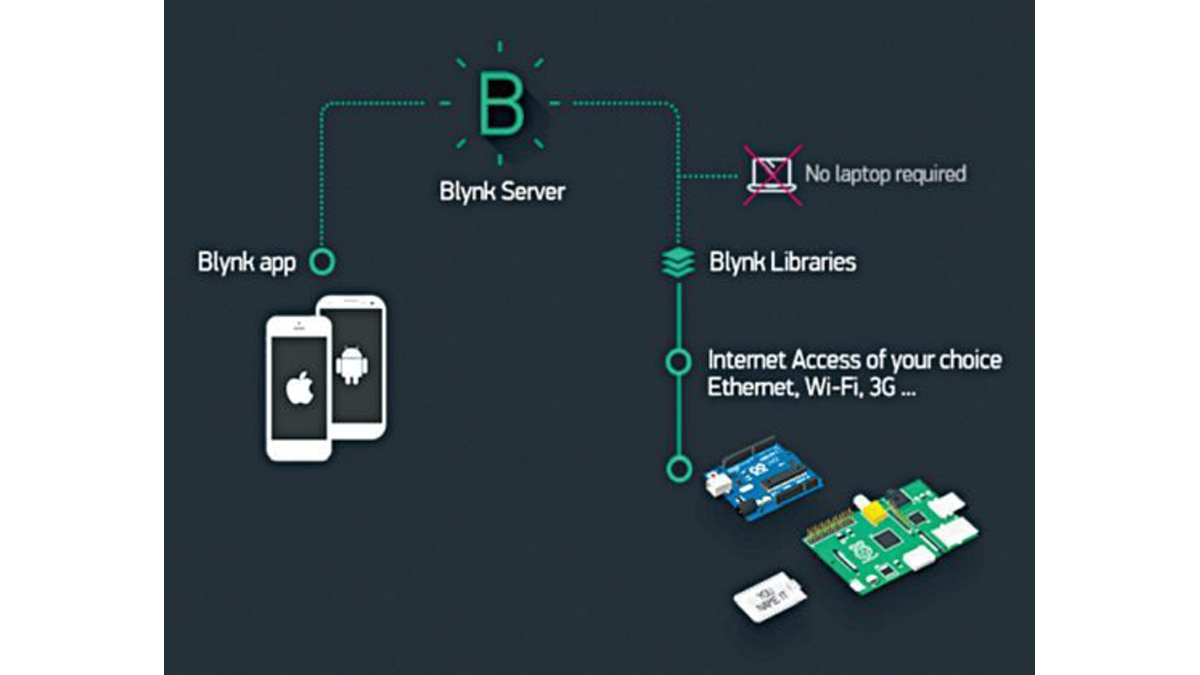
How Blynk works
Blynk can control hardware remotely. It can display sensor data, store and visualise it, among other cool things. There are three major components in the platform as given below:
Blynk app
It allows you to create amazing interfaces for your projects using various widgets.
Blynk server
It is responsible for all communication between the smartphone and hardware. You can use Blynk Cloud or run your private Blynk server locally. It is open source, and can handle thousands of devices. It can also be launched on Raspberry Pi.
Blynk libraries
Libraries are available for all popular hardware platforms. The libraries enable communication with the server, and process all incoming and outgoing commands.
When you press a button on Blynk app on the phone, the signal travels to the Blynk Cloud, where it finds its way to the hardware. It works the same way in the opposite direction, and everything happens in a blink of an eye. The concept is shown in Fig. 1.
IoT enabled air pollution meter
The following hardware components are used in the air pollution meter:
Controller and sensors
Arduino Uno is used as a control and measuring unit, and Arduino Uno Ethernet shield for connection to the Blynk Cloud. The sensors include nova PM sensor SDS011, gas sensor MQ135, and temperature and humidity sensor DHT11.
Smartphone and digital dashboard
Android phone is used as a smartmeter. Blynk app is a well-designed interface builder. It works on iOS and Android, and provides easy-to-use widgets for the LCD, push buttons, on/off buttons, LED indication, RTC and more. Using Blynk digital dashboard features in a smartphone helps reduce the cost of the project because traditional LCD display, mechanical buttons, LEDs, RTC and so on are not required. The digital dashboard or smartmeter display is shown in Fig. 2.
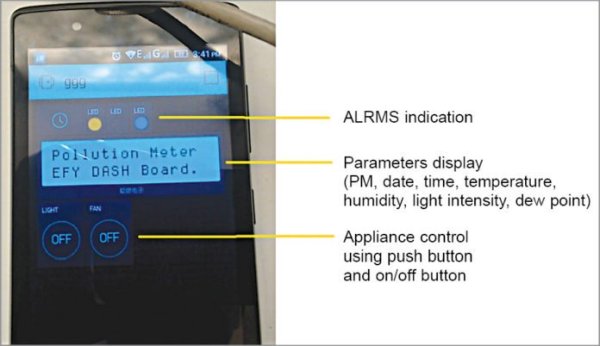
Digital dashboard on Android phone
Circuit and working
Circuit diagram of the IoT enabled air pollution meter with digital dashboard is shown in Fig. 3. Heart of the circuit is Arduino Uno board with Arduino shield. Other components used are voltage regulators 7805 (IC1 and IC2), temperature and humidity module DHT11 connected to connector CON3, gas sensor MQ135 connected to connector CON2, PM2.5/PM10 sensor connected to connector CON1 and a few others.
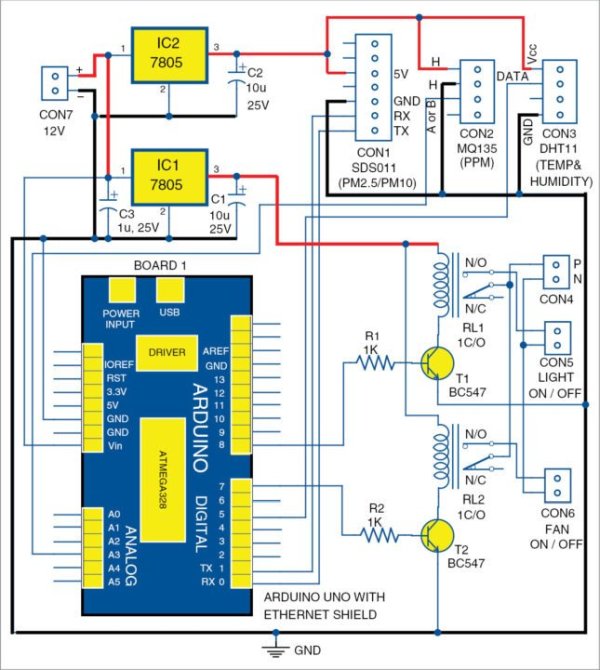
Circuit diagram of the PM2.5/10 IoT enabled air pollution meter
PM2.5/PM10 sensor (SDS011)
Particle pollution, also called particulate matter (or PM), is a mixture of solid particles and liquid droplets floating in the air. Some particles are released directly from a specific source, while others are formed in complicated chemical reactions in the atmosphere.
The PM2.5/PM10 sensor connected across CON1 was developed by INOVAFIT, which is a spin-off from University of Jinan, China. It uses the principle of laser scattering in the air, and can detect suspended particulate matter concentration ranging from 0.3 to 10 microns. Data collected by the sensor is stable and reliable. SDS011 sensor is connected to UART port (TX and RX) of Arduino Uno board.
Gas sensor (MQ135)
Sensitive material of the sensor is tin-dioxide, whose conductivity increases with the concentration of gas. Change in conductivity is converted into output voltage signal, which varies corresponding to the concentration of combustible gas. MQ135 is highly sensitive to ammonia, sulphide and benzene steams, smoke and other harmful gases. It is a low-cost sensor, suitable for different applications. Output of the gas sensor is connected to analogue input pin A3 of Arduino Uno board through connector CON2.
Temperature and humidity sensor (DHT11)
This composite sensor contains calibrated digital signal outputs of temperature and humidity. Connected to connector CON3, it includes a resistive-type humidity measurement component and an NTC temperature-measurement device. Its output pin is connected to digital pin 5 of Arduino Uno board. It is a relatively inexpensive sensor for its performance.
Additional features
Additional alarm indication and control through relays RL1 and RL2 have been provided. The two appliances (light and fan) can be connected to connectors CON5 and CON6, but you can add more as per your requirement. Connector CON4 is used for connecting 230V AC mains to drive the lamp and fan connected at CON5 and CON6, respectively.
Power supply
A 12V battery or supply is connected to connector CON7, which is regulated to 5V using 7805 regulators (IC1 and IC2). When the system is powered on, the device takes one minute to preheat the gas sensor before it is ready for operation. The whole sensor circuit can be powered by 9V or 12V adaptor or battery. Here, IC1 and IC2 have been used for driving various parts of the circuit.
Enclose the whole sensor circuit (Fig. 3) in a suitable box, which should be placed where you want to monitor air quality or pollution.
Ethernet shield
Arduino Ethernet shield allows you to easily connect Arduino to the Internet. This shield enables Arduino to send and receive data from anywhere in the world, with an Internet connection.
Digital dashboard setup
Step 1. Mount Ethernet shield on Arduino Uno and connect Board1 to PC using a USB cable.
Step 2. Change the IP address in IPAddress IP (your IP address) in Arduino sketch ethernetclient.ino. This sketch/program code can be downloaded from the end of the article.
Compile and upload the code into Arduino Uno from Arduino IDE. This code shows you how to make an HTTP request using an Ethernet shield. It returns a Google search for the word Arduino. Results of this search are viewable as HTML through Arduino’s serial window.
Step 3. Compile ethernetserver.ino sketch and upload it to Arduino Uno board. Change your IP address in IPAddress IP (your IP address) in the sketch. In this example, use your Ethernet shield and Arduino board to create a simple Web server. Using the Ethernet library, your device will be able to answer an HTTP request with the Ethernet shield.
After navigating to the Ethernet shield’s IP address, Arduino will respond through HTML browser and will be ready to accept input values from analogue pins (A0 through A5) of Board1.
Step 4. Connect your mobile with Wi-Fi. Download and install Blynk app from Google Play store. Then, create a new Blynk account (Fig. 4). This account is separate from the accounts used for Blynk Forums, in case you already have one.
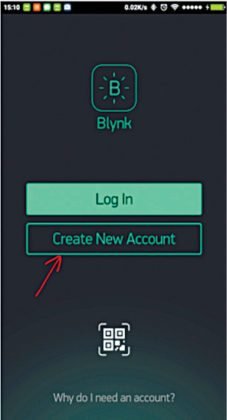
Creating a new account in Blynk
An account is needed to save your projects and have access to these from multiple devices anywhere in the world. It is also a security measure. We recommend using a real email address because it will simplify things later.
Step 5. After you have successfully logged into your account, start by creating a new project (Fig. 5), and give it a name.
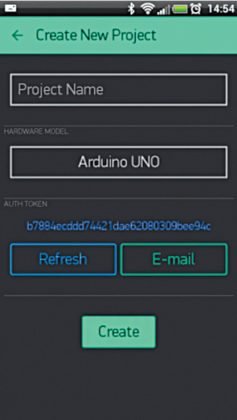
Creating a new project window
Step 6. Select the hardware model you intend to use. In this case it is Arduino Uno (Fig. 6).
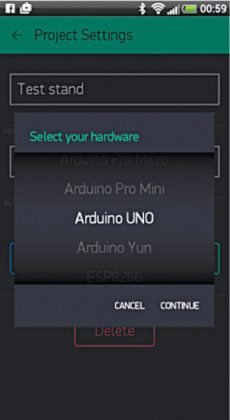
Selecting the hardware
Step 7.
Authorisation (or Auth) token is a unique identifier that is needed to connect the hardware to your smartphone. Every new project you create will have its own Auth token (Fig. 7). Click email button and the token will be sent to the email address you used for registration. Use this token in auth[] = “your token” in pollution.ino file.
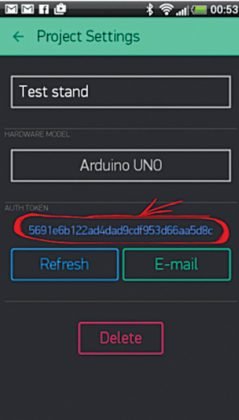
Typical authorisation token
Download Blynk library (Blynk_v0.3.4.zip) from https://github.com/blynkkk/blynk-library/releases/tag/v0.3.4, and include it in Arduino IDE. Compile and upload pollution.ino code to Arduino board.
Step 8. Press Create (Fig. 8).
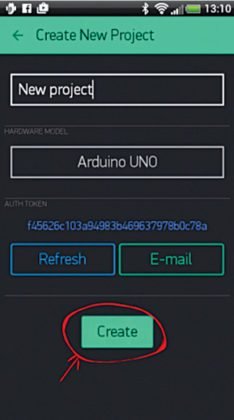
Pressing Create button
Step 9.
Your project canvas is empty at the moment. Tap anywhere on the canvas to open the widget box; all available widgets are located here. Add widgets (Fig. 9).
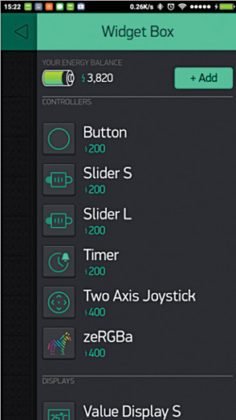
Widget Box window
Add the following widgets in the settings and make the screen look like a digital dashboard as shown in Fig. 2. This includes adding the LCD (Fig. 10), LED, on/off switch, pushbuttons and RTC widgets.
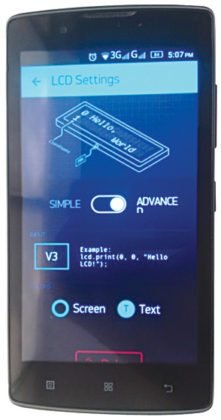
LCD widget setting
Step 10.
Run the project. When you are done with the settings, press Play (Fig. 11). This will switch the display from edit to play mode where you can interact with the hardware. While in play mode, you will not be able to drag or set up new widgets. Press Stop and get back to edit mode. In play mode, you will find the screen shown in Fig. 12.

Play button
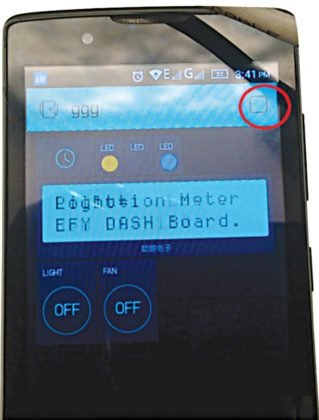
Play mode
EFY notes:
Use different Wi-Fi networks for your Android mobile and Arduino sensor board for a proper IoT based test.
Source :IoT-Enabled Air Pollution Meter With Digital Dashboard On Smartphone