Sometimes voltage fluctuations occur in the main electricity supply in our homes offices etc. These fluctuations can occur due to the interruption of heavy load, lightning and switching impulses. This can lead to the electronics part damage and sometimes causes major accidents. Voltage fluctuation or irregularities are also major issues in industrial appliances and often can damage sensitive electronic equipment.
This blog will tell you how to design the high/low voltage protection until its PCBA manufacturing.
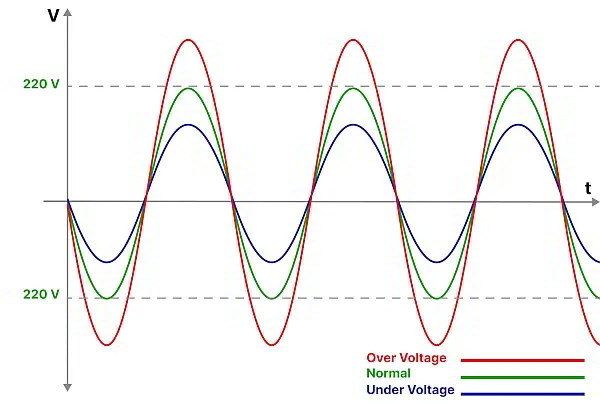
Voltage Protection Circuit
First, understand the voltage protection circuit basics and the required components.
To save electronic appliances from such hazards, we will make a system that automatically turns the appliances by opening the circuit. The system will also alert on the 16×2 LCD. The microcontroller that will be used is Arduino. With an onboard programmer, it is easy to program it rather than other micro-controllers. There is no need for using an external programmer or USB-to-serial converter FTDI etc.
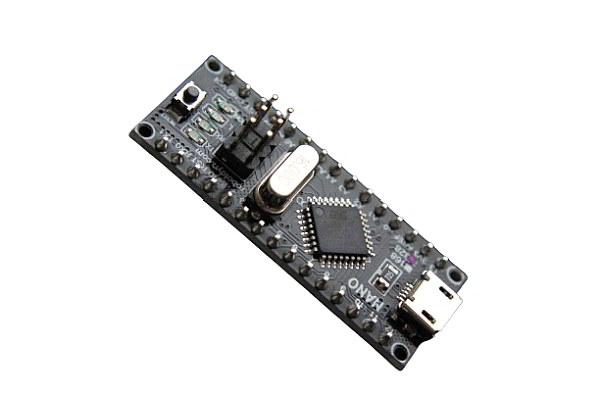
Voltage Sensor ZMPT101B
The main component of the system is the sensor ZMPT101B. It is a voltage sensor. The pinout diagram of the sensor is shown below.
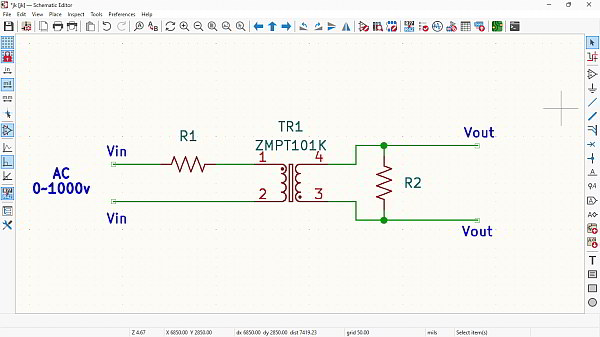
ZMPT101B is a high-precision voltage transformer. It can be used to monitor AC mains voltage up to 1000 volts. This transformer holds up to 4kV per breakdown voltage, the ratio of turns is 1: 1, but this is a current transformer of 2mA: 2mA. We feed it a current and remove the current. The input current is simply set by the resistor in series R1, and we use a sampling resistor R2 in parallel to get the output voltage.
The internal circuit of the ZMPT101B sensor is shown below.
Using ZMPT101B with Arduino
Connect the Vcc pin of the sensor to the 5v of Arduino, connect the GND pins to the GND pin on Arduino, and connect the signal pin of the sensor to analog pin A0 of Arduino as shown in the diagram.
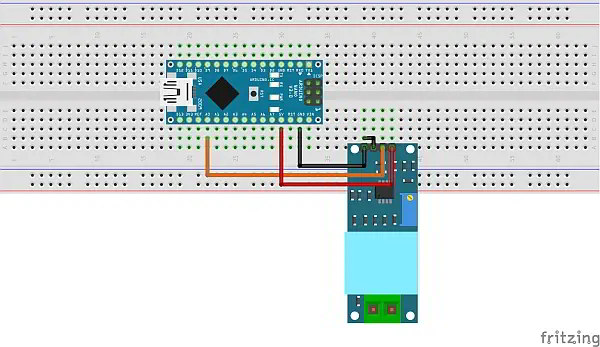
Connect the Arduino to the computer via a USB-to-serial cable.
Select the port on which Arduino is attached and board as Arduino Nano. Use the following code. Compile and upload it.
void setup() {
Serial.begin(9600);
}
void loop()
{
Serial.println(analogRead(A0));
delay(100);
}
Open the serial monitor, the value of the measured voltage will be shown on the serial monitor. This was a basic example of how to use the sensor ZMPT101B. Here is a sample code for interfacing the ZMPT101B Voltage Sensor module with Arduino.
int adc_max = 0;       // Variable to store the maximum sensor value
int adc_min = 1023;    // Variable to store the minimum sensor value
long tiempo_init;      // Variable to store the initial time
void setup() {
Serial.begin(115200);   // Initialize the serial communication
tiempo_init = millis(); // Get the current time in milliseconds
}
void loop() {
if ((millis() - tiempo_init) > 500) { // Check if 500 milliseconds have passed
adc_max = 0;         // Reset the maximum sensor value
adc_min = 1023;      // Reset the minimum sensor value
tiempo_init = millis(); // Update the initial time
}
int sensor value = analogRead(A0); // Read the analog input from pin A0
if (sensor value > adc_max) {
adc_max = sensor value; // Update the maximum value if a new maximum is found
} else if (sensor value < adc_min) {
adc_min = sensor value; // Update the minimum value if a new minimum is found
}
// Print the maximum and minimum values to the serial monitor
Serial.print("adc_max: ");
Serial.print(adc_max);
Serial.print("   adc_min: ");
Serial.println(adc_min);
delay(1); // Small delay for stability between each iteration
}
- It initializes variables to store the maximum and minimum sensor values and records the initial time.
- In the loop, it reads an analog sensor and updates the maximum and minimum values if necessary.
- If 500 milliseconds have passed since the last reset, it resets the maximum and minimum values.
- It then prints the maximum and minimum values to the serial monitor with appropriate labels and introduces a small delay for stability.
For Calibrating the value use the potentiometer on the sensor.
Working for Circuit:
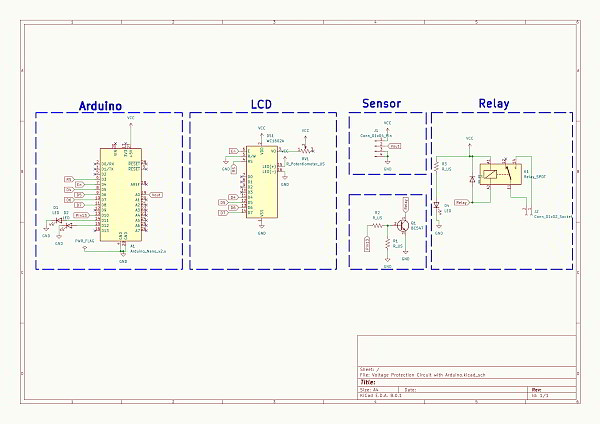
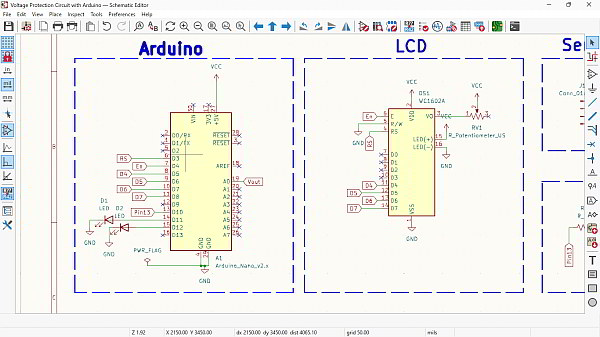
The circuit schematic has been drawn in KiCAD 8.0. The main blocks are shown separately. Connect the Arduino to the 16×2 LCD as shown. Connect the 16×2 LCD Pin 4, 6, 11, 12, 13, and 14 to Arduino D3, D4, D5, D6, D7, and D8 Pin. Use a 10K Potentiometer at Pin 3 of LCD to adjust LCD Contrast. Supply 5V to LCD Pin 2 & 15. Connect LCD Pin 1, 5 & 16 to GND of Arduino.
For relay, the transistor BC547 has been used as a switch. A resistor of 330 ohm is connected on the base of the transistor the transistor collector is connected to the relay.
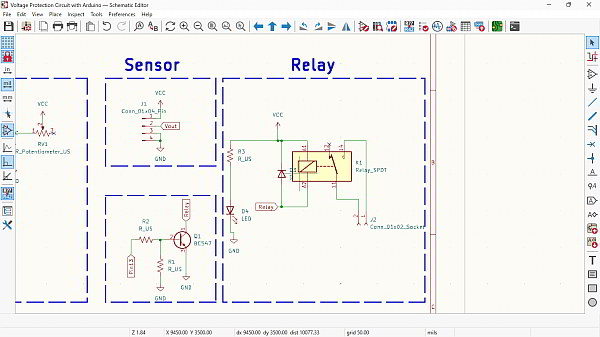
Multiple loads can be connected across the output of Relay. The load may be the AC Bulbs or any home appliances operating at 220V. As discussed above in the connection of ZMPT101B with Arduino, The ZMPT101B is an analog sensor. Therefore connect the analog pin of the sensor to the Arduino A0 Pin. You can power the ZMPT101B, Relay Module using the 5V Pin of Arduino. The ZMPT101B accepts the input AC Voltage of 220V or over in our case. To test the Arduino Over & Under AC Voltage Monitoring Protection Circuit, the AC Fan Dimmer is the best option.
Programming Arduino:
Use the following code on the circuit as drawn in the schematic.
#include
#include
const int rs = 3, en = 4, d4 = 5, d5 = 6, d6 =7, d7 = 8;
LiquidCrystal lcd(rs, en, d4, d5, d6, d7);
float testFrequency = 50;
int Sensor = 0;
int relay = 10;
int yellow = 12;
int green = 11;
float intercept = 0.7;
float slope = 0.04;
float current_Volts;
unsigned long printPeriod = 1000;
unsigned long previousMillis = 0;
void setup()
{
lcd.begin(16, 2);
pinMode(relay, OUTPUT);
pinMode(yellow, OUTPUT);
pinMode(green, OUTPUT);
lcd.print("Voltage:");
delay(1000);
}
void loop()
{
RunningStatistics inputStats;
while ( true )
{
Sensor = analogRead(A0);
inputStats.input(Sensor);
if ((unsigned long)(millis() - previousMillis) >= printPeriod)
{
previousMillis = millis();
current_Volts = intercept + slope * inputStats.sigma();
current_Volts = current_Volts * (40.3231);
lcd.setCursor(9, 0);
lcd.print(current_Volts);
lcd.print("V");
}
if ( (current_Volts > 0)  &&  (current_Volts < 190) ) { lcd.setCursor(0, 1); lcd.print("Under Voltage"); digitalWrite(relay, LOW); digitalWrite(yellow, LOW); digitalWrite(green, HIGH); } if ( (current_Volts >= 190)  &&  (current_Volts <= 220) ) { lcd.setCursor(0, 1); lcd.print("Normal Voltage"); digitalWrite(relay, HIGH); digitalWrite(yellow, LOW); digitalWrite(green, LOW); } if ( current_Volts > 220 )
{
lcd.setCursor(0, 1);
lcd.print("Over Voltage");
digitalWrite(relay, LOW);
digitalWrite(yellow, HIGH);
digitalWrite(green, LOW);
}
}
}
Code Explanation:
- LCD Setup: The LCD object is initialized with pin connections for its operation.
- Setup Function: In the setup function, the LCD is initialized with the specified dimensions, and pins for relay and LEDs are configured as outputs. The initial message “Voltage:” is printed on the LCD.
- Loop Function: The loop function continuously operates:
- Sensor Reading: Analog sensor readings are continuously collected.
- Voltage Calculation: Statistics for sensor readings are collected and used to calculate the current voltage, which is then scaled.
- Display: The current-voltage reading is printed on the LCD, along with the unit “V”.
- Voltage Analysis: Depending on the voltage level, different messages are displayed on the LCD, and corresponding actions are taken:
- If the voltage is under a threshold, an “Under Voltage” message is displayed, and the relay is turned off while the green LED is turned on.
- If the voltage is within a normal range, a “Normal Voltage” message is displayed, and the relay is turned on while LEDs are turned off.
- If voltage exceeds a threshold, an “Over Voltage” message is displayed, and the relay is turned off while the yellow LED is turned on.
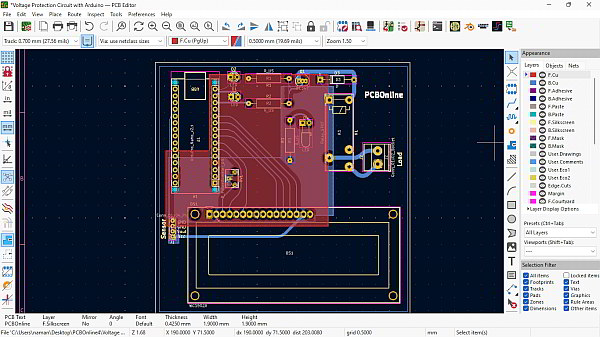
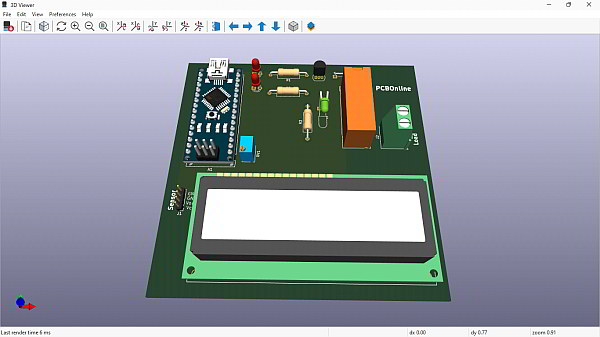
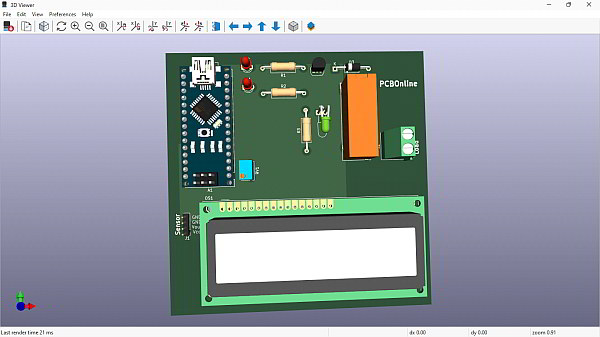
The PCB for the circuit is 2 layers. Following are the images of the PCB layout and the fabrication JLC PCB Gerber viewer.
- Software Used:


