Summary of Bode Plot on an Oscillscope
This guide explains how to build a low-frequency spectrum analyzer with a tracking generator using an Arduino and an AD9850 DDS sine wave generator connected to an oscilloscope. The system generates an exponentially ramped sine wave to create a logarithmic frequency axis, allowing users to visualize filter responses between 15Hz and 1MHz.
Parts used in the Low Frequency Spectrum Analyzer:
- Arduino microcontroller
- AD9850 DDS sine wave generator breakout module
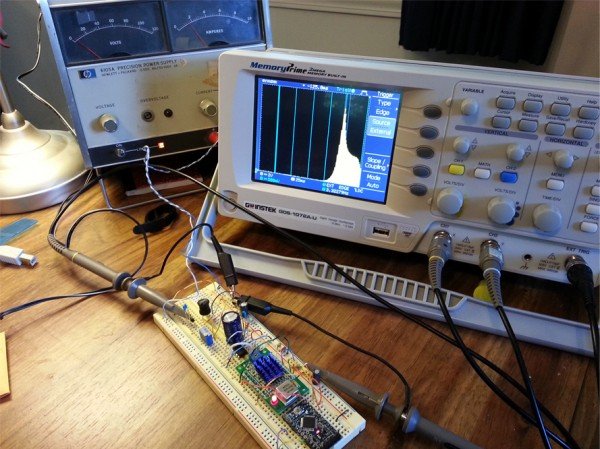
- Oscilloscope
Maybe you’re learning about filters and want to see the how your filter responds in the 10Hz to 1MHz range. This guide will show you how to make a low frequency ‘spectrum analyzer with tracking generator’ using a few cheap modules and an oscilloscope — Based off of a video done by Dave Jones over at EEVBlog.
Dave does a great job going into the theory, so check out the video if you want to see how it works! He will also show you how to set up the scope. Check out my video below for the reader’s digest version.
Some important notes
For the audio crowd — the vertical scale is still in volts, not decibels. There is also no information on phase shift.
Arduino math
Brief Theory
The circuit from this guide generates a sine wave and the frequency of this sine wave ramps up exponentially. This creates a logarithmic axis on the horizontal axis of your scope. The filter under test will then react differently as the frequency is ramped up. Finally everything will be displayed on the oscilloscope which is synced via the external trigger. The oscilloscope and the Arduino will also need the same time settings.
15Hz-10Khz sweep with simulation
15Hz-1Mhz sweep with simulation. marker at 50Khz (approx peak)
One major problem is that the oscilloscope’s horizontal axis markings aren’t going to be placed correctly all the time. To solve this the microcontroller will calculate where the axis bars should be and generate a 1ms pulse at 10Hz, 100Hz, 1000Hz, etc.… The two screenshots show different generated axis and there are some simulations to compare results.
Hardware
For this project I used an Arduino (breadboard friendly) to do the timing/math/markings, but the star of the show here is the AD9850 DDS sine wave generator. It’s easiest if you are using a breakout for the AD9850. Luckily they may be found on ebay for about 5$ with free shipping! This seems to be the breakout specs from the original creator — EIM377_AD9850 (pdf)
For more detail: Bode Plot on an Oscillscope
- What is the primary purpose of this project?
To create a low frequency spectrum analyzer with a tracking generator for observing filter responses. - How does the circuit generate a logarithmic axis on the scope?
The circuit generates a sine wave whose frequency ramps up exponentially. - Can I use decibels for the vertical scale in this setup?
No, the vertical scale remains in volts rather than decibels. - Does the device provide information on phase shift?
No, there is no information provided on phase shift. - Why does the microcontroller generate a 1ms pulse?
To calculate and mark the correct positions for axis bars at frequencies like 10Hz, 100Hz, and 1000Hz. - What is the estimated cost of the AD9850 breakout module?
They can be found for about 5$ with free shipping on sites like eBay. - How are the oscilloscope and Arduino synchronized?
They must share the same time settings and the scope is synced via external trigger. - What frequency range can this simulation cover?
Simulations show sweeps from 15Hz to 10Khz and up to 1MHz.