Summary of Arduino Frequency Detection
The article describes an Arduino sketch that samples audio at 38.5 kHz, detects signal slope to produce a pulse at each zero-to-peak transition, and measures frequency for arbitrary waveforms. It includes a clipping LED on pin 13, uses direct port manipulation for speed inside an ADC interrupt, and suggests projects like pitch-reactive lighting, audio-to-MIDI, and audio effects. It references an audio input circuit Instructable and shows oscilloscope examples of pulse outputs for sine and complex waves.
Parts used in the Frequency Detection Project:
- Arduino (with analog input A0 and digital pins 12 and 13)
- Audio input circuit (as described in the referenced Instructable)
- Signal source (sine wave or arbitrary audio signal)
- LED for clipping indicator (connected to pin 13)
- Wiring/jumper cables
- Oscilloscope (used for observing pulse output and input waveform)
- Optional RGB LEDs or actuators for pitch reactive projects
- Optional MIDI interface hardware for audio to MIDI projects
As a follow up to the Arduino Audio Input tutorial that I posted last week, I wrote a sketch which analyzes a signal coming into the Arduino’s analog input and determines the frequency. The code uses a sampling rate of 38.5kHz and is generalized for arbitrary waveshapes. I’ve also turned the LED attached to pin 13 into a clipping indicator, so you know if you need to adjust your signal’s amplitude as you send it into the Arduino.
Some project ideas for the code presented here include:
pitch reactive projects– change the color of RGB LEDs with pitch, or make a lock that only opens when you sing a certain pitch or melody
audio to MIDI conversion– get the Arduino to translate an incoming signal into a series of MIDI messages. See my instructable about getting the Arduino to send and receive MIDI for lots of example code to get started
audio effects– use the frequency information to reconstruct an audio signal from the tone() library or with some stored samples to make a cool effects box/synthesizer
The first step of this project is to set up the audio input circuit. I wrote a detailed Instructable about that here.
Step 1: Detection of Signal Slope
First I wanted to experiment with peak detection, so I wrote a piece of code (below) that outputs a high signal when the incoming audio signal has a positive slope, and outputs a low signal when the incoming audio signal has a negative slope. For a simple sine wave, this will generate a pulse signal with the same frequency as the sine wave and a duty cycle of 50% (a square wave). This way, the peaks are always located where the pulse wave toggles between its high and low states.
The important portion of the code is reproduced below. All of this code takes place in the ADC interrupt (interrupts and runs each time a new analog in value is ready from A0, more info about what interrupts are and why we use them can be found here)
prevData = newData;//store previous value
newData = ADCH;//get value from A0
if (newData > prevData){//if positive slope
PORTB |= B00010000;//set pin 12 high
}
else if (newData < prevData){if negative slope
PORTB &= B11101111;//set pin 12 low
}
I should note here that in this tutorial I use direct port manipulation to turn off and on the output pin (pin 12) of the Arduino. I did this because port manipulation is a much faster way of addressing the Arduino’s pins than the digitalWrite() command. Since I had to put all the code above inside an interrupt routine that was going off at 38.5kHz, I needed the code to be as efficient as possible. You can read more about port manipulation on the Arduino website, or see the comments I’ve written above to understand what each line does. You’ll also notice in the code below that I used some unfamiliar commands in the setup() function so that I could get the Arduino’s analog input to sample at a high frequency. More info on that can be found in my Arduino Audio Input tutorial.
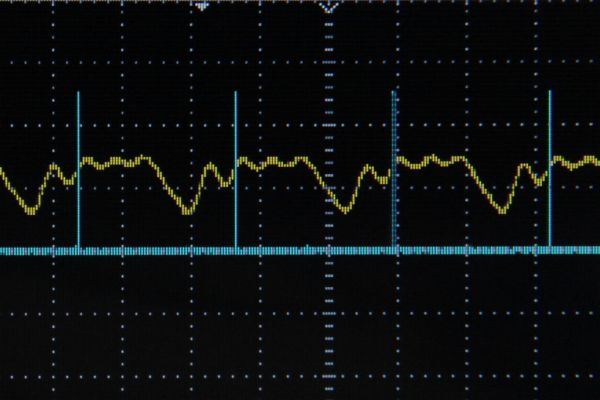
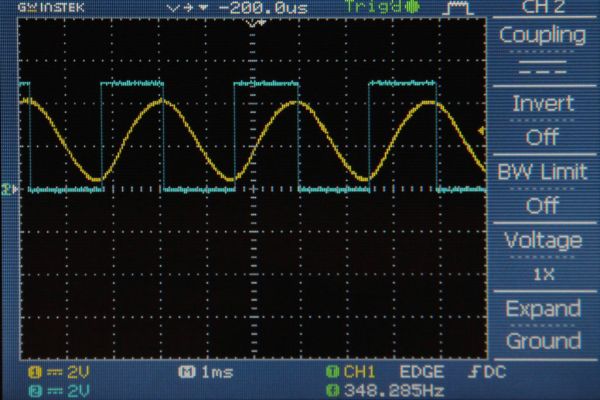
Fig 1 shows the pulse output in blue and the sine wave in yellow on an oscilloscope. Notice how the pulse output toggles each time the sine wave reaches a maximum or minimum. Fig 2 shows the pulse output in blue for an arbitrary waveshape in yellow. Notice here how pulse wave takes on an irregular duty cycle because the incoming signal (yellow) is much more complicated than a sine wave.
For more detail: Arduino Frequency Detection
- How does the sketch detect frequency?
It samples the audio at 38.5 kHz, detects signal slope changes in the ADC interrupt, and generates pulses at peaks to determine frequency. - Can the code handle arbitrary waveshapes?
Yes, the code is generalized for arbitrary waveshapes and produces pulses based on slope changes, though duty cycle may vary. - Why is direct port manipulation used instead of digitalWrite?
Direct port manipulation is used because it is much faster and necessary for efficient execution inside the 38.5 kHz ADC interrupt. - What is the purpose of the LED on pin 13?
The LED on pin 13 is used as a clipping indicator to show when the signal amplitude needs adjustment. - How is the pulse output produced?
The code compares consecutive ADC samples and sets pin 12 high on a positive slope and low on a negative slope, producing a pulse output. - What sampling rate does the sketch use?
The sketch uses a sampling rate of 38.5 kHz. - Can this be used for audio to MIDI conversion?
Yes, the article suggests using the frequency information to translate incoming signals into MIDI messages as a possible project. - What projects are suggested using this code?
Suggested projects include pitch-reactive RGB LED control, lock/unlock by singing pitches or melodies, audio-to-MIDI conversion, and audio effects or synthesizers.