Periodically measure environmental conditions and send them to WolkAbout IoT Platform to monitor the environment remotely.
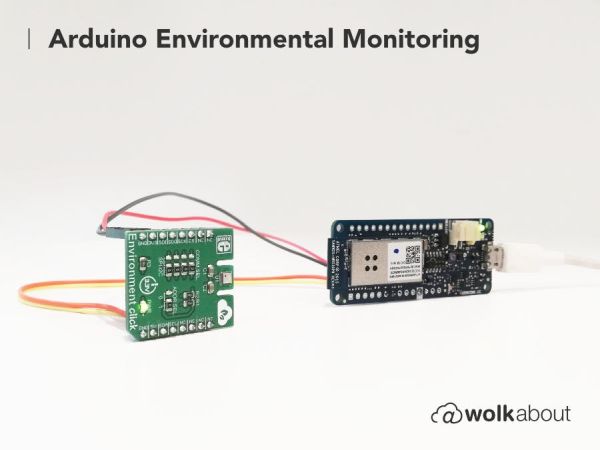
Things used in this project
Story
Introduction
We had some Environment click sensors handy, so we decided to hook them up to the Arduino MKR1000 and visualise them on WolkAbout IoT Platform. The idea was to do a measurement every minute and publish the results once every 15 minutes. If the publishing of sensor readings fails (due to a busy network or some other issue), then the results should be persisted in the Flash memory of the device. With a potential maximum of 96 writes a day, we minimise the chances of getting the Flash memory into a wrong state (Arduino guarantees 10,000 write cycles).
Hardware setup
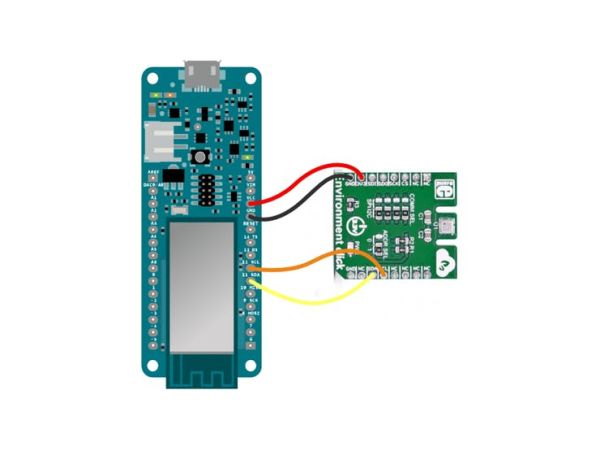
The Environment click sensor is hooked up to the I2C communication pins (namely 11 and 12 on the MKR1000), Vcc and ground.
Software setup
We used a couple of libraries to make this project possible, all of which can be installed from Arduino IDE’s library manager, or by downloading.zip archives from GitHub repositories listed in the attachments and then adding them to Arduino IDE.The required libraries are:
- WiFi101
- Adafruit Unified Sensor Driver
- Adafruit BME680 Library
- RTCZero
- FlashStorage
- WolkConnect
Once all the required libraries are installed, go ahead and copy the content of Environment monitoring sketch from the attachments into Arduino IDE.
It implements a structure of a circular buffer and uses it to store the measurement results. There is also an implementation of how to store that structure in Flash memory using the FlashStorage library. Timed reading and publishing of the data are achieved by using the RTCZero library. Initially, after connecting to WiFi we send a ping to WolkAbout IoT Platform to get the current epoch that will be fed into the RTC library so the sensor readings can be properly timestamped.
An alarm interrupt changes flags for tasks that need to be done (read and publish) and the rest of the work is handled in the loop function. Here we check if we need to read or publish. For minimal power consumption, WiFi is set to be in a low power mode as well as the MKR1000. The sensor on the Environment click goes low powered way automatically until a reading is requested.
Changes that have to be made to the sketch include entering WiFi credentials on line 33 and 34:
const char* ssid = "<*YOUR SSID*>";
const char* wifi_pass = "<*YOUR WIFI PASSWORD*>";
as well as entering device credentials from WolkAbout IoT Platform.
To get these credentials, you need to create a device first by using a device template.
The device template for this project, Environment click-deviceTemplate.json, is available in the project’s attachments, so create a copy of it. Log in to or create your account on WolkAbout IoT Platform and navigate to the Devices section.
Select the Device templates tab and then press the + sign and select the Upload option, navigating to your local copy of the device template.
Now that a device template is available, you can create a device from it by clicking Create device.
The following form has the Environment click device template pre-selected, so simply press Next step.
Here, you need to give your device a name and tick the checkbox for Create semantic group for this device (necessary for creating widgets on your dashboard later on).
Press Save and the form with device credentials will be displayed. Store this information however you want and then enter it into your sketch in Arduino IDE: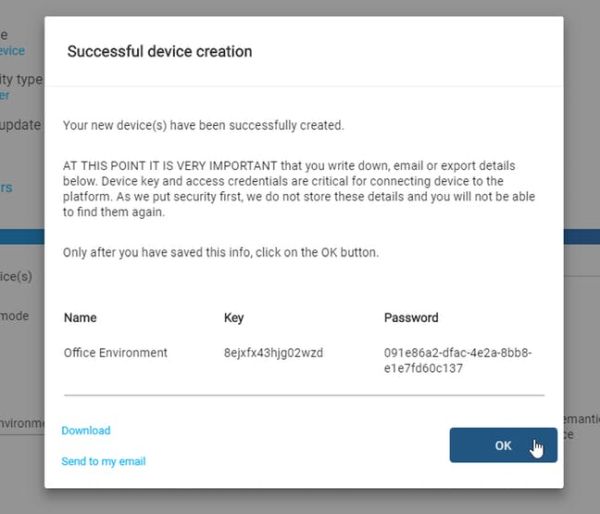
const char *device_key = "device_key";
const char *device_password = "device_password";
Now you can go ahead, verify and upload this sketch to your board, but you still need to create a way to display the received sensor data.
To display this data, switch over to Dashboards tab on WolkAbout IoT Platform and create a new dashboard by pressing + and entering a name for the dashboard. Then you can start adding widgets to your dashboard by pressing Add widget.
Select Control
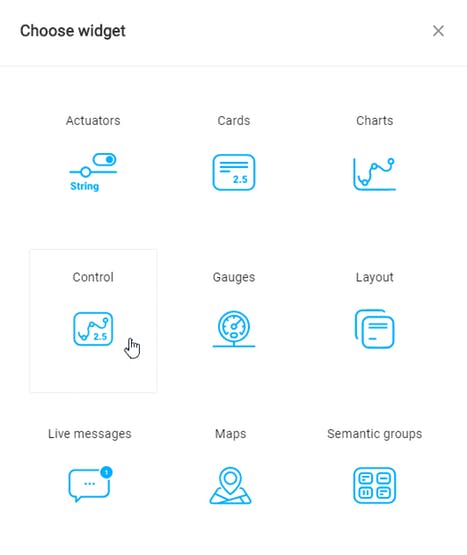
and then select Temperature from your device.
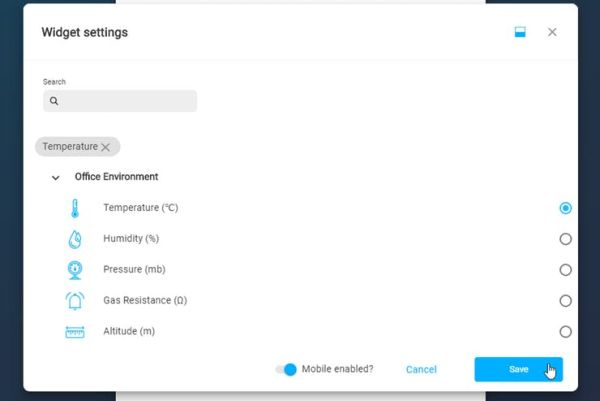
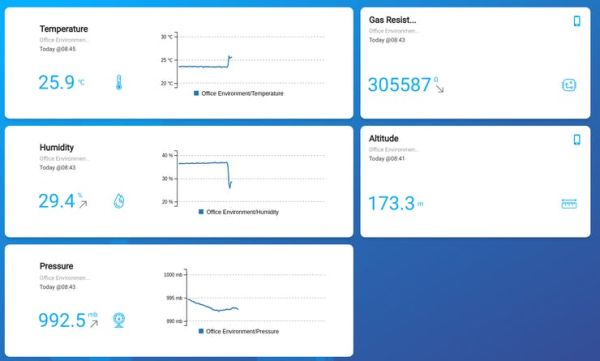
Repeat the process for Pressure and Humidity. Create another widget of the type Card, select Altitude and create another card widget for Gas Resistance. You can rearrange the widgets as you like it.
After adding widgets for the whole individual sensor reading you expect to receive from your device, the following dashboard will be ready to receive the data from your device.
So, go ahead and deploy the device to the environment you have chosen and monitor the conditions remotely.
Conclusion
By connecting Arduino MKR1000 and Environment Click to the WolkAbout IoT Platform, you created an energy-efficient way to report the environmental conditions of the place you want to monitor remotely. This solution can be extended through the use of WolkAbout IoT Platform’s rule engine, which allows you to receive different types of notifications if a certain value passes a threshold you defined.
For more information about the rule engine and other WolkAbout IoT Platform’s features, you can visit our User Guides page.
Schematics
Code
Source : Arduino Environmental Monitoring


