Summary of Arduino Based Weather Monitoring System
This article presents an automated weather monitoring system using Arduino to measure temperature, humidity, light intensity, altitude, and atmospheric pressure. The system collects data via sensors, processes it through an Arduino microcontroller, displays real-time readings on an LCD, and stores information in a database for graphical analysis and weather forecasting without human error. It also includes actuators to adjust environmental conditions like heating or cooling based on preset thresholds.
Parts used in the Arduino Based Weather Monitoring System:
- Arduino Micro-controller
- DHT11 Temperature and Humidity Sensor
- LM35 Temperature Sensor
- LDR (Light Dependent Resistor)
- Bmp180 Atmospheric Pressure Sensor
- Altitude Sensor
- 16x2 LCD Display
- Servo Motor
- Power Supply (+5v)
- Switches for LCD and Backlight Control
Abstract— Weather is the state of the atmosphere, to the degree that it is hot or cold, wet or dry, calm or stormy, clear or cloudy. Most weather phenomena occur in the troposphere, just below the stratosphere. Weather generally refers to day-to-day temperature and precipitation activity, whereas climate is the term for the average atmospheric conditions over longer periods of time. When used without qualification, “weather”, is understood to mean the weather of earth. Monitoring the weather conditions manually is difficult. The present work is to develop an automated system which monitors the weather condition. The weather condition is driven by air pressure (temperature and moisture) differences between one place and another. These pressure and temperature differences can occur due to the sun angle at any particular spot. Through this system we can automatically collect the information about humidity and
temperature. The details are stored in a database and according to current and previous data we can produce the results in graphical manner in the system. The objective of this paper is to formulate the weather and be able to forecast the weather without human error. Keywords— Climate control, Weather analysis, Temperature Moderation, Moisture Control, Humidity Control, Arduino, Monitoring.
INTRODUCTION
Weather forecasting is the application of science and technology to predict the state of the atmosphere for a given location. Human beings have attempted to predict the weather informally for millennium and formally since the nineteenth century. Weather forecasts are made by collecting quantitative data about the current state of the atmosphere on a given place and using scientific understanding of atmospheric processes to project how the atmosphere will evolve on that place.
Weather is driven by air pressure (temperature and moisture) differences between one place and another. These pressure and temperature differences can occur due to the sun angle at any particular spot, which varies by latitude from the tropics. The atmosphere is a chaotic system, so small changes to one part of the system can grow to have large effects on the system as a whole. This makes it difficult to accurately predict weather more than a few days in advance, though weather forecasters are continually
working to extend this limit through the scientific study of weather, meteorology. It is theoretically impossible to make useful day-today predictions more than about two weeks ahead, imposing an upper limit to potential for improved prediction skill.
Once an all-human endeavor based mainly upon changes in barometric pressure, current weather conditions, and sky condition, weather forecasting now relies on computer-based models that take many atmospheric factors into account. Human input is still required to pick the best possible forecast model to base the forecast upon, which involves pattern recognition skills, tele-connections, knowledge of
model performance, and knowledge of model biases.
2. LITERATURE REVIEW
Through weather monitoring system we can collect the information about humidity and temperature and according to current and previous data we can produce the results in graphical manner in the system. After reviewing many articles, there are presently no papers that mention monitoring the combination of temperature, lighting and humidity in one integrated system and have actuators to modify these settings. In addition to this, there is one research paper that has discussed monitoring these three environmental
conditions; however, there has been no mention about having actuators to modify. So our main idea was to coin a system that can sense the main components that formulates the weather and can be able to forecast the weather without human error.
Ancient weather forecasting methods usually relied on observed patterns of events, also termed pattern recognition. For example, it might be observed that if the sunset was particularly red, the following day often brought fair weather. This experience accumulated over the generations to produce weather lore. However, not all of these predictions prove reliable, and many of them have since been found not to stand up to rigorous statistical testing. The simplest method of forecasting the weather, persistence, relies upon today’s conditions to forecast the conditions tomorrow. This can be a valid way of forecasting the weather when it is in a steady state, such as during the summer season in the tropics. This method of forecasting strongly depends upon the presence of a stagnant weather pattern. It can be useful in both short range forecasts and long range forecasts. Measurements of barometric pressure and the pressure tendency (the change of pressure over time) have been used in forecasting since the late 19th century.
3. PROPOSED SYSTEM
There are a lot of high end systems available these days for round the clock weather monitoring. But these systems are implemented on a very large scale, for monitoring real time weather for a whole city or state. Implementing such system for a small area is not feasible, since they are not designed for it and the overhead for maintaining such systems for a small area is very high.
Our proposed system makes use of 3 sensors to measure the weather/environment factors such as temperature, humidity, light intensity, dew point and heat index. The values read from the sensors are processed by the Arduino micro-controller and stored in a text file which can be processed upon to derive analysis. The readings are also displayed on an on board LCD for quick viewing. All
these readings can be analyzed to get the weather characteristics of a particular area and record the weather pattern. These recorded parameters are essential and vary from places to places. All these requirements are fed into the database and these values are essentials and recorded over time. Using these values as input we can plot a weather chart of a particular area over time. Based on the present
weather factors and preset values the set actions are done. The set action can include turning on the heating system when the temperature is colder than the set value and turning on the cooling system when the temperature is hot or humid beyond the set values.The serial output from the Arduino micro-controller which are the values read from the sensors can also be stored in a database. The database can be used as a source for data if we want to display values through a website or a standalone application.
The modules that make up the weather monitoring system have been carefully and well thought of, to make sure that the sensors used are giving the most accurate reading and are compatible with the Arduino micro-controller. The modules used for the weather monitoring system can be summarized as follows:
Humidity Sensor:
This sensor will provide the current humidity reading of the surrounding.
Temperature Sensor:
This sensor is used for reading the temperature and also to calculate dew point and heat index.
Light sensor:
This sensor is used for measuring the light intensity falling on the sensor.
LCD:
16×2 LCD display is used to display the readings in real time manner. This is also human interface to the system.
Altitude sensor:
To measure the altitude of the region. It is used to calculate the atmospheric pressure.
Atmospheric pressure sensor:
The readings provide the atmospheric pressure incident experienced on the given region.
4. WORKING PRINCIPLE
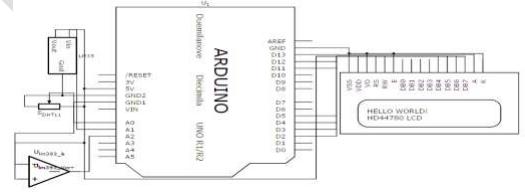
The working principle of this work describes the interdependent functionality of the components and their output. The circuit diagram is shown in Fig. 1. Firstly, all the components are initialized by supplying the required power of +5v. There are two temperature sensors, lm35 and dht11; we are using two temperature sensors to get a accurate value of temperature reading and taking the average of the two values. Depending on the temperature, hot air or cool air introduced to maintain the temperature threshold value, which is preset. If the temperature is too low for the particular area hot air is blown in to bring the temperature to moderation. Otherwise, if the temperature is too high, cold air is blown and thereby raising the temperature to the required level. This is how temperature is manipulated. Secondly, there is an LDR which work based on light intensity. When the sunlight is too much or not enough for the
plant to handle, the servo motor opens or closes the door of the glass box based on the readings of the LDR. This helps in recording the natural light incident on the area. The natural light intensity may wary from time to time. This is important in agricultural applications, where light is required for the growth of plants and some plants may not grow well in low light. On the other hand, when the light intensity is high throughout the year, such areas or places are suitable to set up solar power stations. Light intensity along
with other parameters such as temperature and humidity can be used in predicting weather forecast without the use of any satellite data.
The gathered data is serially fed into a computer, which uses the com port to communicate with the Arduino device and the data recorded is stored in a text file. The text file can be directly imported to an excel file with the functionality of a macro. The imported data is then sorted and formatted, and charts are then plotted with the imported data. The charts present a visual representation of the data, which shows the weather pattern over a recorded period of time. The visual patterns indicate the weather behavior of the particular region. This is the primary objective of the present work.
The DHT11 sensor provides the current temperature are humidity readings. The DHT11 gives out analog output and is connected to the analog input of the Arduino micro-controller A0. The dht11 sensor has 3 pins. Along with temperature and humidity the other values that are calculated or derived from the dht11 sensor is the dew point, heat index etc. The dew point is the temperature at which air in the atmosphere freezes to become water droplets and the heat index is the heat felt by the human skin from the environment. This is important in places with high humidity. Even though the temperature maybe lower, the body still feels warm. This is due to the high humidity in the air. Humidity is the moisture content in the air. High humidity in the air generally makes one to sweat or perspire.
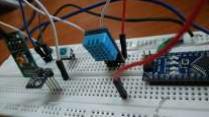
The lm35 is a general purpose temperature sensor. The need of this sensor is to get an additional reading of the temperature. Along with the dht11 sensor’s temperature reading, we calculate the lm35 sensors temperature reading as well and an average of the two readings are taken to get an accurate reading of the surrounding temperature. Fig. 2 sensor arrays used in the system. Bmp180 sensor is used to measure the atmospheric pressure and the temperature as well. The atmospheric pressure is used to determine the relative air pressure experienced in the surrounding. This is very useful if we are using the system in high altitude environment and a calibrated value of the altitude along with other environmental readings provides a good projection of the surroundings weather pattern and we can notice changes with increase or decrease in altitude.
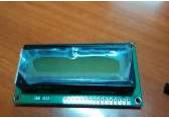
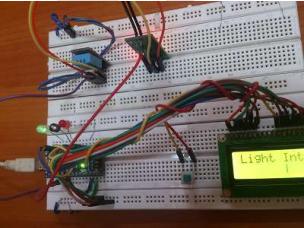
The readings from the sensors are displayed in a 16×2 LCD shown in Fig. 3 which is directly connected to the Arduino microcontroller. This is useful when we are using the device indoors or only to get the readings on a screen. The LCD is also functional when the device is connected to a laptop where the readings are recorded. There is on-board switch provided to turn on/off the LCD in order to preserve the battery in case we are powering the device using external batteries. There is a switch provided to turn on/off the LCD’s back-light display. The back-light display consumes a lot of battery power. This is useful when we want to preserve the battery and also keep the LCD on.
Through weather monitoring system we can collect the information about humidity and temperature and according to current and previous data we can produce the results in graphical manner in the system. The graphical charts can also be uploaded to websites from where in it can be accessed from anywhere. The data can also be used for pattern analysis, where in the weather parameters are recorded for a long period of time. The accumulated data is used for analysis for weather prediction. So our main idea was to coin a system that can sense the main components that formulates the weather and can be able to forecast the weather without human error. However, regardless how small the average error becomes with any individual system, large errors within any particular piece of guidance are still possible on any given model run.
5. COMPONENTS
Arduino is an open source tool for making computers that can sense and control more of the physical world than your desktop computer. It’s an open-source physical computing platform based on a simple micro-controller board, and a development environment for writing software for the board. Arduino can be used to develop interactive objects, taking inputs from a variety of switches or sensors, and controlling a variety of lights, motors, and other physical outputs. Arduino projects can be stand-alone, or they can
communicate with software running on your computer (e.g. Flash, Processing, MaxMSP). The boards can be assembled by hand or purchased pre-assembled; the open-source IDE can be downloaded for free. Arduino micro-controller is shown in Fig. 4.
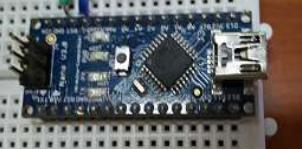
The Arduino programming language is an implementation of Wiring, a similar physical computing platform, which is based on the Processing multimedia programming environment. It has 14 digital input/output pins (of which 6 can be used as PWM outputs), 6 analog inputs, a 16MHz ceramic resonator, a USB connection, a power jack, an ICSP header, and a reset button. It contains everything needed to support the micro-controller; connect it to a computer with a USB cable or power it with an AC-to-DC adapter or battery to get started. All the modules in the circuit are connected to Arduino module.
DHT11 – Temperature and Humidity Sensor This sensor is used to sense humidity. It facilitates us with analog and digital output. We are using digital output pin to connect it directly with the Arduino to Arduino’s digital pin (pin 7).there is a step up register in the sensor to control the power. VCC and GND
pins are also connected to Arduino. Fig. 5 shows a DHT11 sensor.
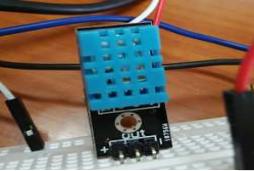
DHT11 has a full range temperature compensation, low power consumption, long term stability and calibrated digital signal. The DHT sensors are made of two parts, a capacitive humidity sensor and a thermistor. There is also a very basic chip inside that does some analog to digital conversion and spits out a digital signal with the temperature and humidity. A high-performance 8-bit microcontroller is integrated in the sensor with calibration-coefficient saved in OTP memory to provide accurate temperature readings. With the new 3 pin connector that includes several soldering pads and a sturdy casing, plugging in and out the sensor is not going to be a problem anymore. The 3 pin connector is perfect to get it going fast, and extremely easy to use. It is reliable and inexpensive.
LDR – Light Dependent Resistor
An LDR is a component that has a (variable) resistance that changes with the light intensity that falls upon it. This allows them to be used in light sensing circuits. A light-dependent resistor (LDR) is a light-controlled variable resistor. The resistance of this decreases with increasing incident light intensity; in other words, it exhibits photo-conductivity. An LDR can be applied in light-sensitive detector circuits, and light- and dark-activated switching circuits. An LDR is made of a high resistance semiconductor. In the dark, an LDR can have a resistance as high as a few mega ohms (MΩ), while in the light, an LDR can have a resistance as low as a few hundred ohms. If incident light on an LDR exceeds a certain frequency, photons absorbed by the semiconductor give bound electrons enough energy to jump into the conduction band. The resulting free electrons (and their whole partners) conduct electricity, thereby
lowering resistance. The resistance range and sensitivity of an LDR can substantially differ among dissimilar devices.
LM35 – Temperature Sensor
It is a 3-pin temperature sensor IC that measures temperature in degree Centigrade and gives output response of 10 mV/°C. Its response is linear and highly suitable for interfacing with the analogue-to-digital converter (ADC) of any micro-controller. For example, if temperature is 25°C, then its output is 250 mV. The sensor operates off 5V DC supply. The output of the temperature sensor is connected to analogue input A5 of the Arduino board The LM 35 temperature sensor is an easy to use, cost-effective sensor with decent accuracy. LM35 is shown in Fig. 6.
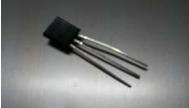
The sensor is essentially a Zener diode whose reverse breakdown voltage is proportional to absolute temperature. We are not using LM 35 directly to connect with the system but we have made a circuit to connect so that the damage ratio can be decreased. One amplifier is there to enhance the voltage or power. A One step up resistor is there to control the voltage power. LM 35 sensor circuit provides analog input and we connect it with the Arduino analog pin for input (pin 1). Three pins are there for analog input, output n ground.
6. ARCHITECTURE DESIGN
The architecture of the weather monitoring system can be illustrated in Fig. 7.
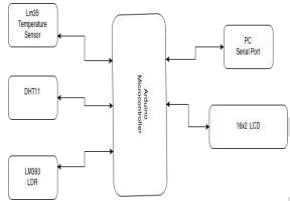
The Arduino micro-controller is the main component that is centrally connected to all the components. The sensors are connected to the analog input of the Arduino micro-controller. The Arduino is also connected to the 16×2 LCD and the PC. These are the outputs from the Arduino. The LCD is connected to the digital pins D5- D2 and RS and E pin are connected to 12 and 11 pin respectively. And the back-light control is connected to digital pin 13. The rest other pins are connected to the GND. The working model is shown in Fig. 8.
7. EXPERIMENTAL RESULTS
All the modules were designed and all the components were assembled. The testing of each module was carried out successfully. The sensor readings were effectively retrieved in a stable environment and stored in files. The files were then imported to excel automatically using macros and the data was cleansed and formatted for a neater representation. Graphical charts were then plotted using the data which presented a nice analytical view of weather pattern based on sensor readings. Thus the testing phase was
completed. This study was performed in a controlled manner. Thus, there is a need to conduct further experiments in environments more similar to real weather conditions. Table below has the results obtained in the experiments.
Source: Arduino Based Weather Monitoring System
- How does the system ensure accurate temperature readings?
The system uses two temperature sensors, DHT11 and LM35, and calculates the average of their values to get an accurate reading. - Can the system forecast weather without satellite data?
Yes, the system can predict weather forecasts by analyzing light intensity along with other parameters like temperature and humidity. - What happens if the temperature is too low?
If the temperature is too low, hot air is blown into the area to bring the temperature up to the moderation threshold. - How is light intensity managed in the system?
An LDR measures light intensity, and a servo motor opens or closes a door based on these readings to control natural light. - Does the system store data for future analysis?
Yes, sensor readings are stored in a text file or database, which can be imported to Excel for plotting charts and pattern analysis. - What is the role of the Bmp180 sensor?
The Bmp180 sensor measures atmospheric pressure and temperature, which helps determine relative air pressure and weather patterns. - How can users view the data locally?
A 16x2 LCD display connected to the Arduino shows real-time readings for quick local viewing. - Is the system suitable for high-altitude environments?
Yes, the system uses altitude and atmospheric pressure readings to provide good projections of weather patterns in high-altitude areas.