The goal of this project is to build a cheap alternative to measuring CO2 ppm in the air. It’s a nice simple way to see over-time change in ppm using a cheap NDIR carbon sensor and a temperature/pressure sensor to achieve better accuracy.
In this project you will need to:
– Solder
– Wire
– Code
– 3D print
It sounds like a lot if you are new to this but hopefully this tutorial will teach you everything you need to know in order to build this project easily.
Step 1: Gathering Materials
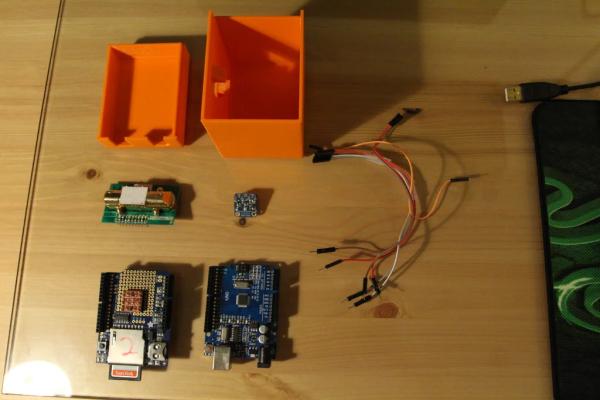
Before starting this project there are a few materials that you will have to buy. I’ve listed everything you will need below along with links to where you can buy them. You should be wary that the CO2 sensor ships from China and you might need to allow some time for it to arrive.
Electronics
· Arduino Uno + USB
· MH-Z14 CO2 Sensor
https://www.alibaba.com/product-detail/Cheap-CO2-G…
· Adafruit BME/BMP280 Temperature/Humidity/Pressure Sensor
https://www.adafruit.com/product/2652
· 7 male – female jumper wires
https://www.adafruit.com/product/826
· 9-12V DC Power Supply
https://www.amazon.com/Elegoo-100V-240V-Converter-…
· Data Logging Shield for Arduino
https://www.adafruit.com/product/1141
· 1220 CR battery
https://www.adafruit.com/product/380
· Stacking Header Pins
https://www.adafruit.com/product/85
· SD card
https://www.amazon.com/Secure-Digital-Sandisk-SDSD…
Once you have all your materials the next step is to solder on the header pins….
Step 2: Soldering Header Pins
The first thing you will need to do in order to complete this step is grab a soldering Iron and some solder. This step is necessary to firstly be able to semi-permanently connect wires to each board and secondly to ensure that data from each shield will be read correctly.
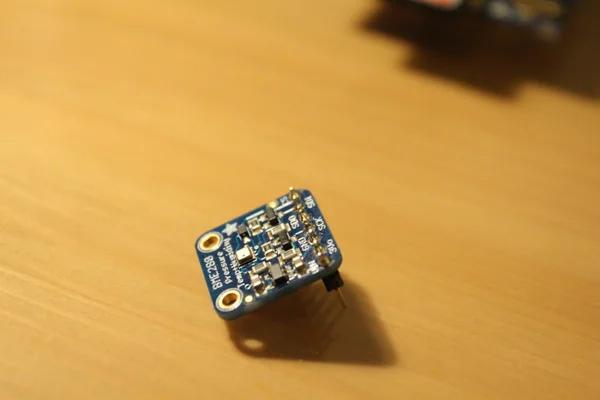
The first board is the BME280 temperature sensor. you will need to solder on the header pins that come with sensor as you can see in this video which clearly explains the process using a different board.
For the second board, the Data Logger, you will need to grab your stacking header pins.These allow you to stack the logger onto your Arduino board and not lose the connections necessary for wiring.
Once you have soldered on all the pins the next step is wiring your project together.
Step 3: Wiring/Hookup
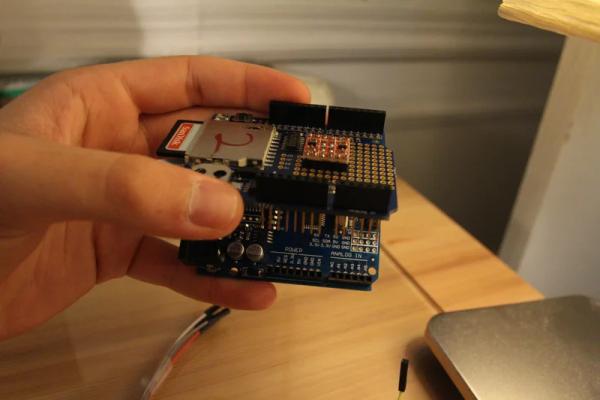
Data Logger
After attaching the header pins it should be easy enough to connect the shield to you Arduino Uno. The shield should sit snuggly on the board and all the pins should align correctly.
BME280 Sensor
using your female/male jumper wires you can connect this sensor to your Arduino Uno. The wire hookups for this sensor are:
BME — Arduino
Vin — 3 V
GND — GND
SCK — A5
SDI — A4
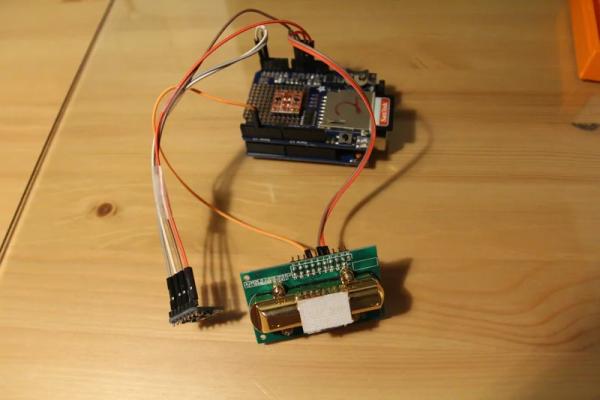
MH-Z14 CO2 Sensor
Each pin here is labelled as Pads 1 through 19 these connect using the female/male jumper wires. The wiring is as follows:
MHZ14 — Arduino
Pad 15 — 5V
Pad 2 — GND
Pad 6 — Digital 3 (PWM ~)
Step 4: Coding Using Arduino
Once all of the wiring is done, its time to connect the arduino to your computer and upload the code.
The first thing you need to do is insert the CR1220 battery into the data logger to get the RTC running. This is an internal clock used to time each data log entry.
Installing Arduino Libraries
https://github.com/samerneergaard/CO2-Data-Logger-…
In order to get the code to work you will need to download and include all the libraries. download the file uploaded in this step called libraries and unzip. Then extract the three folders into your Arduino Libraries folder and restart Arduino to make sure they run with the software.
Alternatively, the link above has all the libraries included all that you have to do is unzip the folder and extract the three folders into your Arduino Libraries folder.
Setting the Logger’s Date & Time (PICTURES 3-5)
Now, the second step is to use the RTC code to upload the present date and time.
It’s quite simple to do this all you have to do is access the RTC library in Arduino and select the library that fits your model of data logger. the way to check the number is by looking at the number on the chip next to your data logger’s battery slot. mine was the DS1307 so I selected that library.
Once the library is open you can uncomment the rtc.adjust(DateTime(F(_DATE_), F(_TIME_))); line by removing the // infront of it to set the present date and time on your data logger.
Then, to upload the code you must select the usb port your arduino is connected to which can be found under; tools–>port–>COM(3). Mine was set to COM3 however yours will automatically display the port it is set at.
Finally you can hit the upload button in order to program the RTC, thereby setting the present date permanently.
In order to test whether the RTC uploaded correctly you can open up the serial monitor and view its date and time if any issues occur upon upload this adafruit guide can help solve the issue.
https://learn.adafruit.com/adafruit-data-logger-sh…
Uploading the CO2 Datalogging Code (Pictures 6-8)
Download & Unzip This Code –> https://github.com/samerneergaard/CO2-Data-Logger-… <—
Once the date and time have been uploaded the rest is straight forward. Simply open up the CO2 DATALOGGER MHZ14 arduino file that you downloaded and upload the code. (compile the code to test it runs with the libraries installed first!)
As long as everything is wired up correctly and the RTC is set, there should be no problems with the upload.
Again, you can test this out by opening the serial monitor of the arduino and viewing the numbers as they are read by the sensors. The CO2 should read between 400-700 ppm if you are outside and 500-1000+ ppm indoors depending on how clean the air around the sensor is. you can also check the pressure and temperature of your location by googling it.
(OPTIONAL) Modifying the Code’s Parameters
Finally, the code is easy to modify if you want to change some of the parameters of the readings.
To change the intervals between log times, simply change the number next to #define LOG_INTERVAL 90000 to any number of seconds you would like. 1 second in this case is equal to 1000.
To get more precise pressure readings, simply change the number inside the brackets of ——————->
#define SEALEVELPRESSURE_HPA (1013.25) to whatever the pressure of your location in mb which can be easily found on google. (side note 1013.25 is the standard pressure used for calculations.)
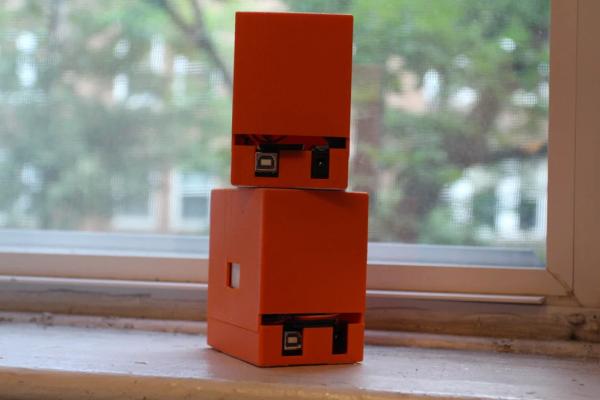
Step 5: 3D Printing and Enclosing
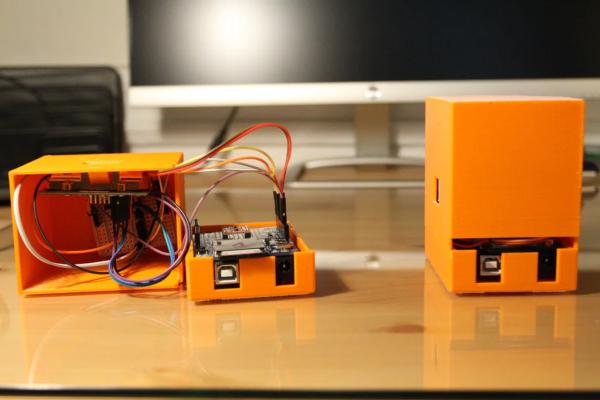
Download the two STL files ready for 3d print, both should be set in millimeters on the machine and then your ready to go!
I printed them on a Mojo maker and it took about 7 hours for the top and 5 hours for the bottom but afterwards the result is great.
Once everything is printed, place the Arduino in the bottom and the MHZ14 into the slot of the top piece.
With everything fitted correctly you can now plug in the DC adapter and let the arduino run for as long as you want to reccord data to the SD card.
Source: CO2 Ppm Sensor Logger ($140)