Home > Projects > Development Board – Kits Projects > Arduino MKR1000 Weather Station

Arduino MKR1000 Weather Station

Summary of Arduino MKR1000 Weather Station


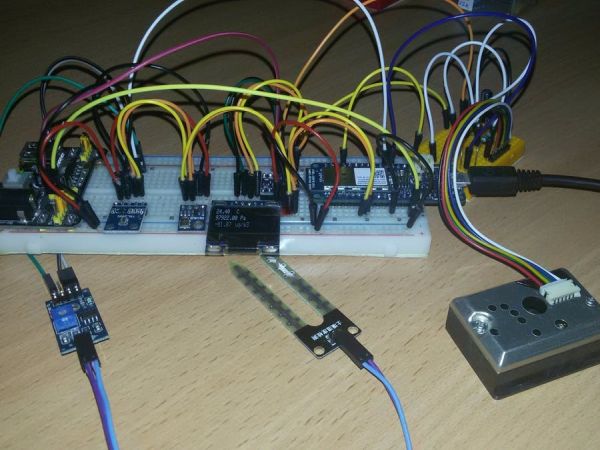
This project builds a mini weather station using an Arduino MKR1000 to monitor temperature, pressure, light, dust, and soil moisture. Data is displayed on an OLED screen and sent to the Cayenne IoT dashboard via MQTT. The system integrates multiple sensors for environmental analysis and provides real-time updates through a custom interface.

Parts used in the Mini Weather Station:

  • Arduino MKR1000
  • Adafruit TSL2561 Luminosity Sensor
  • Adafruit BMP180 Barometric Pressure/Temperature Sensor
  • OLED display I2C
  • SparkFun Level Shifter Board
  • Sharp GP2Y1010AU0F Dust Sensor
  • Soil Moisture Sensor
  • Breadboard (generic)
  • Jumper wires (generic)

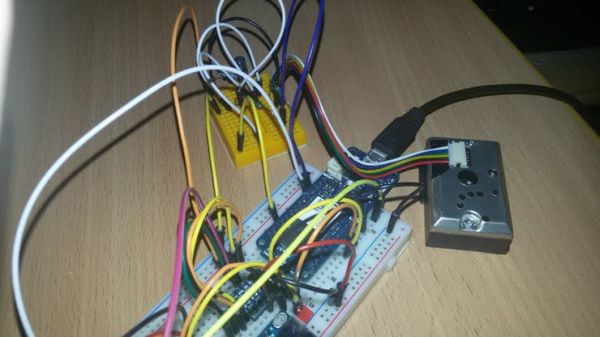
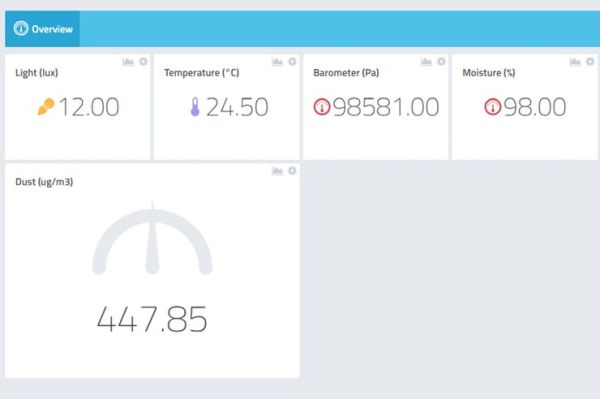
Weather station monitors temperature, pressure, light, dust, soil moisture values and displays on the OLED screen and Cayenne dashboard.

2017-01-14_12_AAloOyrgpB

Things used in this project

Hardware components

Arduino MKR1000
Arduino MKR1000
× 1
Adafruit TSL2561 Luminosity Sensor
× 1
Adafruit BMP180 Barometric Pressure/Temperature
× 1
OLED display I2C
× 1
Level Shifter Board
SparkFun Level Shifter Board
× 1
Sharp GP2Y1010AU0F
× 1
Soil Moisture Sensor
× 1
Breadboard (generic)
× 1
Jumper wires (generic)
× 1

Software apps and online services

Arduino IDE
Arduino IDE
Cayenne
myDevices Cayenne

Story

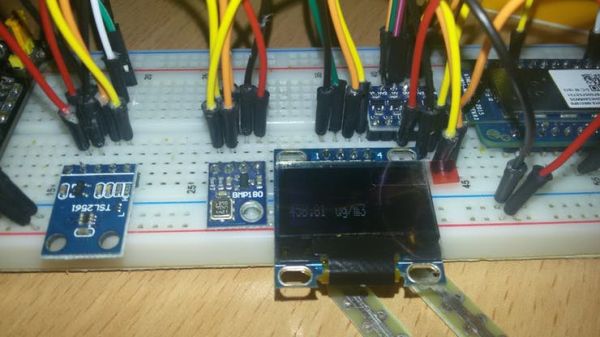
The OLED display shows the temperature, pressure and dust. The Arduino MKR1000 is connected to the Cayenne over MQTT.

Connecting the Arduino MKR1000 to Cayenne:

  • Add new: Device/Widget
  • Bring Your Own Thing
  • Add code to Username, Password and Client ID
  • Add code to SSID and Password from your Wi-Fi
  • Upload code to the Arduino MKR1000
  • Wait for board to connect

Add Widgets:

  • Add new: Device/Widget
  • Custom Widgets
  • Select a widget that you need
  • Enter the name of the widget
  • Select device, Virtual Pin, Pin number
  • Select Data, Unit, Icon
  • Add Widget

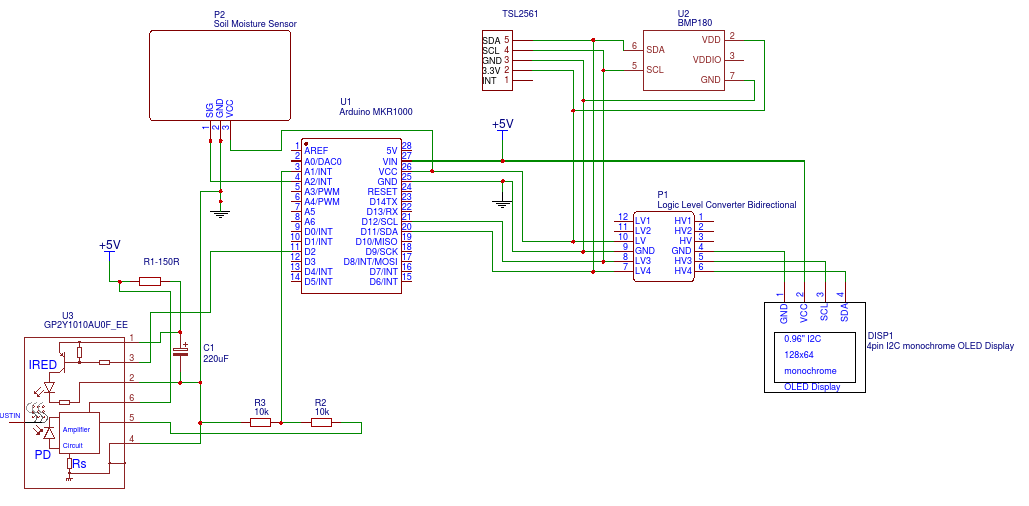
Schematics

Code

Untitled file

Arduino

#define CAYENNE_PRINT Serial  // Comment this out to disable prints and save space
#include <CayenneMQTTMKR1000.h>

#include <Wire.h>
#include <Adafruit_Sensor.h>
#include <Adafruit_SSD1306.h>
#include <Adafruit_BMP085_U.h>
#include <Adafruit_TSL2561_U.h>

#define OLED_RESET 4
Adafruit_SSD1306 display(OLED_RESET);

#define BAROMETER_PIN V1
#define TEMPERATURE_PIN V2
#define LIGHT_PIN V3
#define DUST_PIN V4
#define MOISTURE_PIN V5

float temperature;
float pressure;
float voltage;
int moisture;

int measuringPin = A1;
int ledPin = 2;
const int timeMeasuring = 280;
const int timeStabilization = 40;
const int timeSleep = 9680;
float voltageAnalog = 0;
float voltageConversion = 0;
float dustiness = 0;


Adafruit_BMP085_Unified bmp = Adafruit_BMP085_Unified(10180);
const int address = TSL2561_ADDR_FLOAT;
Adafruit_TSL2561_Unified tsl = Adafruit_TSL2561_Unified(address, 12345);

// WiFi network info.
char ssid[] = "SSID";
char wifiPassword[] = "Password";

// Cayenne authentication info. This should be obtained from the Cayenne Dashboard.
char username[] = "Username";
char password[] = "Password";
char clientID[] = "ClientID";

unsigned long lastMillis = 0;


void setup()
{
  Serial.begin(9600);
  Cayenne.begin(username, password, clientID, ssid, wifiPassword);
  pinMode(ledPin,OUTPUT);
  display.begin(SSD1306_SWITCHCAPVCC, 0x3C);
  if (!bmp.begin())
  {
    CAYENNE_LOG("No BMP sensor detected");
    while (1);
  }
  if (!tsl.begin())
  {
    CAYENNE_LOG("No TSL2561 detected");
    while (1);
  }

  tsl.enableAutoRange(true);
  /* Changing the integration time gives you better sensor resolution (402ms = 16-bit data) */
  tsl.setIntegrationTime(TSL2561_INTEGRATIONTIME_13MS);      /* fast but low resolution */
  // tsl.setIntegrationTime(TSL2561_INTEGRATIONTIME_101MS);  /* medium resolution and speed   */
  // tsl.setIntegrationTime(TSL2561_INTEGRATIONTIME_402MS);  /* 16-bit data but slowest conversions */
}

void loop()
{
  Cayenne.loop();

  //Publish data every 10 seconds (10000 milliseconds). Change this value to publish at a different interval.
  if (millis() - lastMillis > 10000) {
    lastMillis = millis();
    //Write data to Cayenne here. This example just sends the current uptime in milliseconds.
   Cayenne.virtualWrite(0, lastMillis);


    sensors_event_t event;
    tsl.getEvent(&event);
    bmp.getPressure(&pressure);
    bmp.getTemperature(&temperature);

    digitalWrite(ledPin,LOW);
    delayMicroseconds(timeMeasuring);
    voltageAnalog = analogRead(measuringPin);
    delayMicroseconds(timeStabilization);
    digitalWrite(ledPin,HIGH);
    delayMicroseconds(timeSleep);
  
    voltageConversion = voltageAnalog * 2 * (3,3 / 1024.0);
    dustiness = (0.17 * voltageConversion - 0.1)*1000;

    moisture = analogRead(A2);


    Cayenne.luxWrite(LIGHT_PIN, event.light);
    Cayenne.hectoPascalWrite(BAROMETER_PIN, pressure);
    Cayenne.celsiusWrite(TEMPERATURE_PIN, temperature);
    Cayenne.virtualWrite(DUST_PIN, dustiness);
    Cayenne.virtualWrite(MOISTURE_PIN, map(moisture, 1023, 0, 0, 100));
    
  }
  display.clearDisplay();
  display.setTextColor(WHITE);
  display.setTextSize(1);
  display.setCursor(0, 0);  
  display.println(temperature);
  display.setCursor(40, 0);
  display.println("C");
  display.setCursor(0, 10);  
  display.println(pressure);
  display.setCursor(55, 10);
  display.println("Pa");
  display.setCursor(0, 20);  
  display.println(dustiness);
  display.setCursor(45, 20);
  display.println("ug/m3");
  display.display();


}

 

Quick Solutions to Questions related to Mini Weather Station:

  • How does the device connect to the internet?
    The Arduino MKR1000 connects to Cayenne over MQTT using provided SSID, password, username, and client ID.
  • What components are required to build this station?
    You need an Arduino MKR1000, luminosity sensor, barometer, OLED display, level shifter, dust sensor, moisture sensor, breadboard, and jumper wires.
  • Does the system display data locally?
    Yes, the OLED display shows temperature, pressure, and dust values directly on the board.
  • Can users customize the widgets on the dashboard?
    Yes, users can add custom widgets by selecting the device, virtual pin, name, unit, and icon in the Cayenne Dashboard.
  • What is the interval for publishing data?
    The code is set to publish data every 10 seconds, though this value can be changed in the loop function.
  • How is the dust level calculated?
    The system reads analog voltage from the Sharp sensor and converts it to micrograms per cubic meter using a specific formula.
  • What software is needed for this project?
    You must use the Arduino IDE and the myDevices Cayenne online service.
  • Which pins are used for the sensors?
    The code defines Virtual Pins V1 through V5 for barometer, temperature, light, dust, and moisture respectively.

About The Author

Ibrar Ayyub

I am an experienced technical writer holding a Master's degree in computer science from BZU Multan, Pakistan University. With a background spanning various industries, particularly in home automation and engineering, I have honed my skills in crafting clear and concise content. Proficient in leveraging infographics and diagrams, I strive to simplify complex concepts for readers. My strength lies in thorough research and presenting information in a structured and logical format.

Follow Us:
LinkedinTwitter
Scroll to Top