Summary of Power Quality Meter ( PQ Monitor) using Arduino
This Arduino UNO project is a Power Quality Meter designed to analyze AC power grid signals, specifically at 60 Hz (or 50 Hz). It features a graphic LCD display and real-time monitoring of up to 63 harmonics, RMS voltage, frequency, and Total Harmonic Distortion (THD). The project uses a novel variable sampling period method with a software-based phase-locked loop on Timer1 to sample exactly 128 points per cycle, eliminating windowing needs and improving measurement accuracy. Safety is ensured via galvanic isolation with a transformer, and software optimizations enable real-time performance with minimal CPU load.
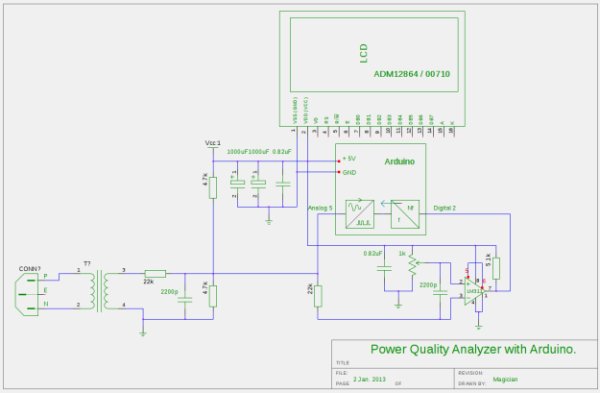
Parts used in the Power Quality Meter:
- Arduino UNO microcontroller
- SparkFun Graphic LCD display (LCD-00710 or equivalent 128×64)
- LM311 comparator IC
- Isolation transformer (primary for 110V or 220V AC, secondary ~10V AC)
- Voltage divider resistors (22kΩ and two 4.7kΩ resistors)
- Two 2200 pF capacitors (for RF filtering)
- Trimming potentiometer (for comparator threshold adjustment)
- Brightness control potentiometer (for LCD backlight)
Arduino UNO project, Power Quality Meter, someone would call it’s PQ Monitor or PQ Analyzer.
I had already published one blog devoted RMS voltage measurements on full band 20 – 20 000 Hz audio signals. ( Following my own style, I’d refer to already published materials whenever it’s possible ). This time measurements performed on single AC Power Grid frequency. ( 60 Hz in Canada. Algorithm would works with 50 Hz as well ).

Features:
- Graphic LCD display 128×64;
- First 5 harmonics presentation;
- RMS Voltage Indicator;
- Frequency Monitoring;
- THD calculation;
- Internal data up to 63-d !!! harmonics components in Real-Time;
The Holy Grail of this project, is a method of sampling input waveform. As there is only one main frequency (fundamental) at the input, I came up with idea to do a sampling period VARIABLE. There are at least 2 great advantages in this brilliant ( may I ? ) invention:
- It’s completely eliminate necessity of the windowing.
- Only ONE period of input waveform is enough for precise calculation.
First of all, windowing is really BAD on metrological side (for accuracy of results), smashing one single frequency bin to over 3 – 5 of it’s neighbors, significantly deteriorating input sensitivity, and plus it’s not able to eliminate limits discontinuity effects well – only attenuate them. Secondly, from software timing performance point of view, introducing windowing in the Real-Time application would automatically require to DOUBLE data throughput, as Overlap – Add procedure would be mandatory.
In it’s essence, I created a software PLL (Phase Lock Loop). Compare to a project with hardware based PLL (IC 74HC4046), no need for external chip this time. Engine is running on Timer1 features – CTC mode and capability to drive ADC Auto trigger. I will go into details in software section.
Hardware.
As you can see on the drawings, circuitry is quite simple, one LCD ( I used SparkFun LCD-00710, could be different ) and one IC, LM311 – comparator. Pay attention, that GEDA doesn’t have a library for such display, all details on LCD configuration, pin numbering etc you can find here. I haven’t experienced any difficulties with assembling LCD, except soldering bunch of wires and installing control brightness level pot. Thanks author of the GLCD library (great work!), there were no troubles with software also.
The transformer is providing galvanic isolation, as the saying goes – prioritizing safety! Any primary winding component for 110V or 220V AC power, without a specific part number, and with around 10V on the secondary side should work fine. The resistive voltage divider values (22k and 2 x 4.7k) can be modified in proportion for transformers with varying secondary voltage outputs. The key is to maintain a voltage level around 2V AC peak value on the arduino analog input # 5. There are two 2200 pF capacitors for filtering RF interference, and one trim pot for adjusting the threshold of the comparators (which could be replaced by a constant voltage divider using two resistors). If an LCD is installed on the same board as the Arduino, it is important to properly separate the +5V power lines to prevent the Arduino from malfunctioning due to excessive interrupts on pin 2 (INT0).
SOFTWARE.
I’ve read an article in December’s issue of the Elektor magazine, that actually inspired me on this project. Even I had such idea in my mind for quite awhile, nevertheless Elektor’s publication accelerate this process. Do you still remember I called my method “brilliant”? And this is why: compare to project published in well known and respectful electronics magazine, my code is running 140 !!! TIMES faster ( compare 5 milliseconds to 700 milliseconds competitors ). I didn’t tweak any optimization. My software is running REAL-TIME in each AC period, keeping load of the microprocessor below 30 %. It’s capable to do a Real-Time monitoring of three phase power line. The only things which is slow down process, is LCD display refreshment. In current version, algorithm averages data over 32 cycles before outputs summary data report on the display, around 0.53 seconds period ( 32 / 60 ). During update display procedure (23 milliseconds, or so) which is longer than 16.66 milliseconds period of the AC 60 Hz, one cycle is skipped. Depends on application, the task of updating screen could be split over many sub-frames, so instead of one big chunk of code, 32 smaller size pieces will go unnoticeable in background, fixing an issue of 33-rd lost frame. But I don’t think it’s necessary for monitoring purposes, may be only in Power Energy Meter project? I just can’t imagine, Elektor’s 2100 milliseconds overall time per cycle, when everything could be done in less than 7 milliseconds ( using split display subroutine ). It’s 300 times difference!.
THE MAGIC.
Software PLL / FLL – Frequency Lock Loop is build on TIMER1 VCO. Well, it’s not quite correct to call it VCO, probably FCO – Frequency Controlled Oscillator. Software adjusts oscillator in such a way, that number of captured samples per one AC waveform has to be exactly 128 . Look here:
if ( smpl_Nmbr > FFT_SIZE ) smpl_Time++;
if ( smpl_Nmbr < FFT_SIZE ) smpl_Time–;
OCR1A = smpl_Time;
OCR1B = smpl_Time;
If the timer restarts frequently during an AC period (1/60 Hz = 16.66 milliseconds) when FFT_SIZE is set to 128, the smpl_Time variable will increase, causing TIMER1 FCO to slow down. If not, smpl_Time decreases, causing the clock to speed up. The usual method of tracking the quantity of captured samples involves incrementing the input array variable smpl_Nmbr during every ADC “start conversion” event triggered by channel B.
ISR(TIMER1_COMPB_vect)
{
if ( smpl_Nmbr < FFT_SIZE )
{
x_r[smpl_Nmbr] = ADC – adc_Offst; //
}
smpl_Nmbr++;
}
( Paralleling Timers two channel A and B was invented here.) The comparators main duty is to trigger digital pin 2 (INT0) exactly in the same point in time, relatively to input signal periodicity. Not necessary at zero. Synchronization point could be at any voltage level on the input waveform, it’s has nothing to do with zero-crossing. As software calculates complete FFT subroutine, for both REAL and IMAGINARY part (btw, referring link) , adjusting point (via pot) to exactly zero-cross simply push all energy in imaginary part (sine). Bringing this point to 45 degree would splits energy equally between real and imaginary parts. Later on, extracting square root from sum of two squares ( magnitude calculation ) simply annihilate any difference, magnitude is not changing with moving synchronization point up and down at all.
DC offset is adjusted in every cycle based on REAL (cosine) bin-0 magnitude:
temp = f_r[0];
if ( temp > 0 )
adc_Offst++;
if ( temp < 0 )
adc_Offst–;
Rolling Filter, the easiest one to implement and understand, and very efficient against spikes.
Arduino UNO sketch: download.
I did some “resource management” in software, because data calculation in each cycle of AC waveform is not really necessary. Let me explain. There are 3 major hardware limits :
- ADC resolution
- Memory size / CPU performance
- Update Rate
In the initial iteration, the analysis of harmonic magnitude extends up to the 63rd harmonic. However, due to the Arduino ADC being limited to 10 bits (9 bits plus sign), it is not practical for real-world electrical grid applications because the magnitude of the 5th harmonics falls below the noise floor at -55.94 dB (0.16%). Two possible solutions are to increase the FFT size or utilize oversampling techniques. The initial approach cannot be implemented because of memory constraints. The second one results in a update rate that is too slow for practical purposes.
In this software update, I restrict calculations to the initial 7 harmonics and display all of them on the screen (refer to the photo). The size of the FFT remains unchanged at 128. With a lower sampling clock, it takes 8 AC cycles to populate the input array with new data. Technique – resampling in the temporal domain. It provides a 3-bit increase in resolution, equivalent to what is already present.
12-bit ADC, overall dynamic range 6.02 x 12 + 1.76 = 74 dB. (0.02%)
Version 2: download.