Project Background
Designing a water system necessitates estimating water pressure throughout, often referred to as “head,” which denotes the vertical column of water height producing that pressure. Pump specifications typically detail the head, indicating a pump with 150 feet of head can lift water vertically up to 150 feet. Understanding the system head allows designers to select appropriately sized equipment and simulate system performance.
However, modeling system heads can be complex, involving considerations such as elevation, pipe dimensions, and more. Therefore, gathering accurate data on the relative elevation between points in the system is crucial.
Engineers Without Borders at the University of Rochester implemented a water chlorination system at a K–8 school in Don Juan, Dominican Republic. This system includes multiple buildings of varying heights and pumps water from a cistern to rooftop water tanks at six different elevations. Due to the sloped terrain, building height does not directly correspond to tank elevation. Moreover, existing survey data for the school is unavailable.
Current methods for surveying relative altitude have notable limitations. Laser rangefinders require direct line-of-sight, surveying GPS units are costly or imprecise, and water levels are cumbersome for transport and use.
A surveying altimeter offers a cost-effective, portable, and user-friendly solution for determining relative height differences between points of interest.
Design Overview
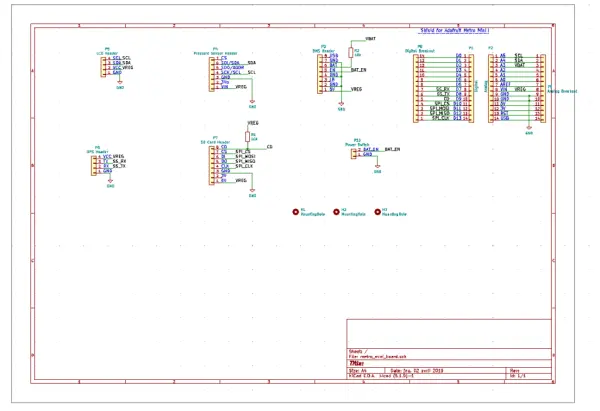
In our design process, we began by identifying the necessary data requirements for cost-effective vertical surveying. This informed our sensor selection and influenced the physical layout of our PCB design, ultimately determining the final form factor of our device.
Initially, our proposal outlined the need for two primary sensor types: a GPS module and a pressure sensor/altimeter. Additionally, we identified the essential components required for system orchestration, including a microcontroller, a battery management system for power efficiency, and an SD card reader for data storage. These components, along with a low-cost Arduino, resulted in a compact configuration of four IC modules of similar size. To enhance user interaction, we integrated an LCD display to provide real-time status updates.
Once we confirmed compatibility among the selected modules and their respective communication protocols, we concurrently tested the system on a breadboard and progressed towards designing the PCB, considering the considerable lead time for custom PCB fabrication.
Upon completing the PCB assembly, our focus shifted to developing the software infrastructure necessary for acquiring and processing the required data. Simultaneously, we began designing an enclosure to house the system’s input/output interfaces. However, during this phase, we encountered challenges regarding the reliability of GPS data obtained from the chosen small, cost-effective module. Initially intended to correct altitude drift in the altimeter readings, our attempts at employing various data processing techniques yielded limited success. After consulting with professors and considering our findings, we opted to pursue an alternative approach.
Our next approach involved utilizing one device as a base station to monitor drift, ensuring both sensors drifted similarly for later offset correction. Subsequently, we focused on gathering altimeter data through a prolonged test setup capable of running for extended periods. Testing throughout a full day revealed that while each sensor drifted, their drift patterns were generally consistent. This observation rendered the GPS unnecessary.
Finally, we restructured the software to facilitate straightforward setup and deployment of devices, including the ability to interchangeably designate the base station without requiring reconfiguration. Concurrently, we continued enhancing the software for efficient data offloading and processing.
For context, altitude in meters above sea level can be derived from a pressure measurement in hPa by:
Altitude = 44330*(1-(Pressure/1013.25)^0.1903)
Results
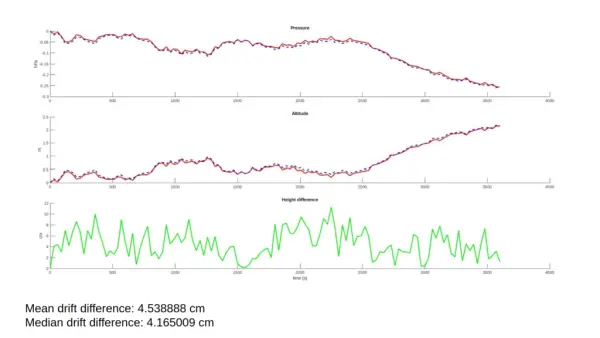
The pressure drift observed between two devices was found to be consistently similar over the course of one hour, which was the intended operational duration. Across 11 trial runs, the average and median drift differences between the two modules ranged from approximately 2cm to 11cm. During each trial, pressure readings were logged every second on both devices, with no movement occurring while data was being recorded.
After confirming the consistency of drift between modules, the use case was put to the test.
An experiment was conducted over a five-minute period to collect sample data, measuring changes in height between landings on outdoor stairs. One module remained at a fixed height, while the other was moved to various points of interest. The corrected and uncorrected heights in meters are detailed below.
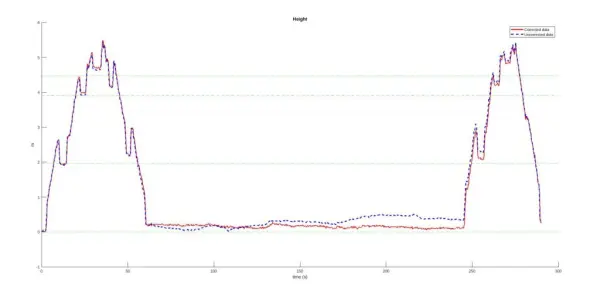
The improved accuracy of the corrected data becomes apparent over time. In this trial, the height initially drifted upward but was swiftly adjusted by the base station’s readings, aligning closely with the expected measurements within just 2 minutes.
Hardware
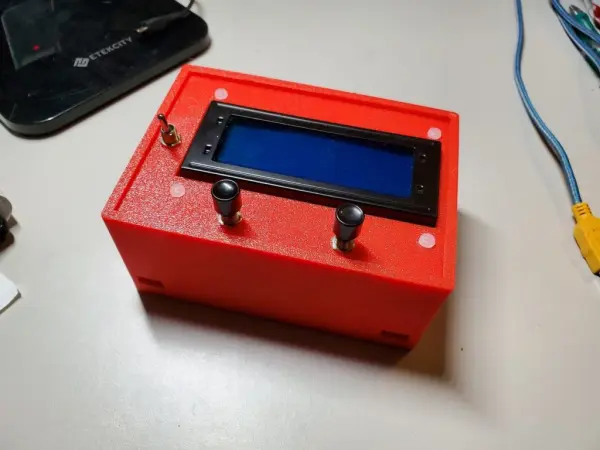
The hardware comprises several IC modules soldered onto a PCB, which is then housed within a 3D-printed enclosure. User input is facilitated by the inclusion of buttons and a power switch integrated into the casing.
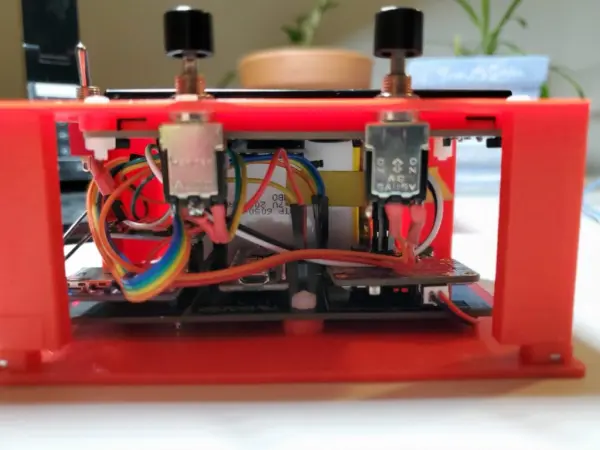
The microcontroller responsible for executing the firmware and interfacing with other IC modules is the compact Arduino METRO Mini. To measure atmospheric pressure in hPa, a DPS310 barometric pressure sensor was employed.
User feedback is provided through a 20×4 backlight LCD with an I2C interface, displaying the device’s current status. Data logging is facilitated by an SD card reader, with pressure readings recorded to the SD card at a rate of 4Hz. Important data points are flagged within the log file.
Powering each module is a rechargeable 3.7V LiPo battery managed by a dedicated battery management system.
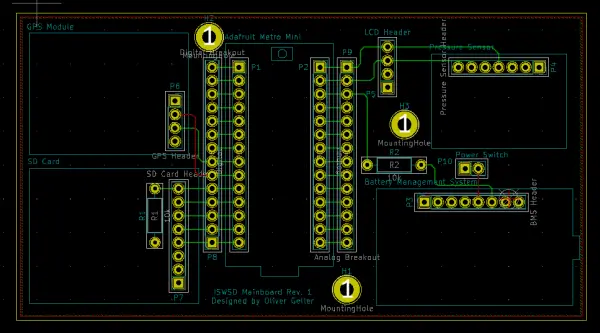
- Adafruit METRO Mini 328 – $12.50
- Adafruit DPS310 – $6.95
- Adafruit MicroSD card breakout board+ – $7.50
- Sunfounder IIC I2C TWI Serial 2004 20×4 LCD – $14.99
- PowerBoost 500 Charger 5V LiPo – $14.95
- Lithium Ion Polymer Battery – 3.7v 2500mAh – $14.95
- Custom PCB – $5
- Total cost per module: $76.84 (excluding case, buttons, wires, etc.)
Software
The Arduino firmware was developed in C++ using the Arduino IDE and Arduino libraries. The firmware operates using a state machine to manage the device’s different operational states. This is achieved by utilizing an enum to define the various state types, and a global structure to store information about the current state, previous state, and other pertinent data that needs to persist between states.
Within the main loop, there are two switch cases that evaluate the current state defined by the enum. One case handles actions specific to the current state, such as displaying information on the screen, while the other manages state transitions.
The software leverages Arduino and Adafruit libraries to facilitate communication and management of the various hardware modules. Libraries are employed for the SD card, LCD display, and pressure sensor modules. The battery management system is the only module without a dedicated library.
One of the states ensures synchronization of both devices at startup, while the subsequent state initiates a 4Hz interrupt timer to acquire and log data. Additionally, the state machine can signal to the interrupt timer when a button press occurs, indicating that the user wishes to mark a specific data point. This approach provides both continuous data logging and the ability to highlight specific points of interest for later analysis.
For access to the code and relevant documentation for the modules, please visit our GitHub repository at: https://github.com/aeleos/ISWSD
Follow this link for complete project: Surveying Altimeter for Water System Design

