Summary of Show CO2 Historical Level Curve With ESP32
The article details an ESP32-based CO2 monitoring project using an SGP30 sensor to address fluctuating readings. By recording historical data, the system draws a line graph on a 3.5-inch LCD, allowing users to distinguish between temporary spikes and actual air quality trends. The setup integrates temperature and humidity sensing while offering flexibility to monitor TVOC or other parameters via code adjustments.
Parts used in the CO2 Monitor with Historical Curve:
- ESP32 microcontroller
- SGP30 sensor board
- DHT11 module
- Buzzer
- 3.5-inch LCD device
- Indoor environment board
Once I had made a project about the CO2 monitor that had such a problem. The displayed value changes too frequently and fluctuates greatly, which makes it impossible for me to accurately judge the CO2 level. I have a point to make it better now—record the history level and draw its to a line.
Step 1: Why to Record Historical Level
For a parameter that is very easy to cause change with a significant range, it makes no meaning to check the level at a certain moment. Like the CO2 level, a very high concentration may be reached at this moment, but it may return to normal in the next moment in a certain area. Usual temperature and humidity in the air are measured by checking the current value, but the CO2 concentration measurement is different. It is the level obtained by measuring the concentration in a certain space with the sensor, which there are too many factors affected: wind, people breathing, temperature, humidity and so on. So recording the historical value is important to judge the CO2 level and changes.
Step 2: Sensor Board
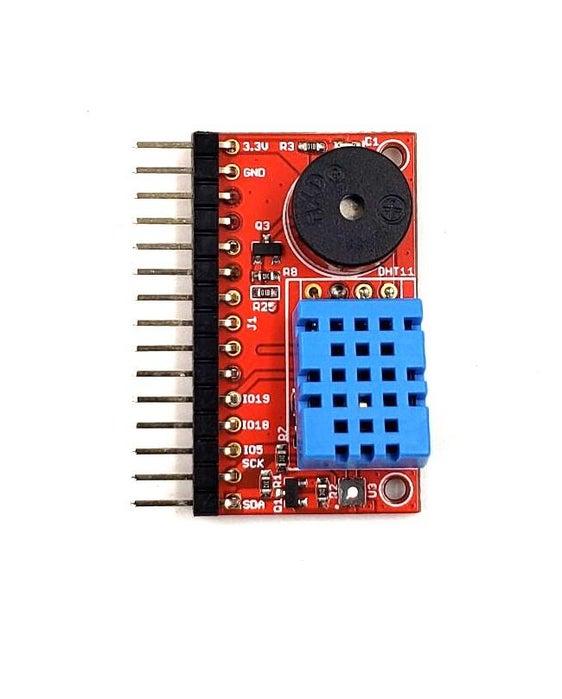
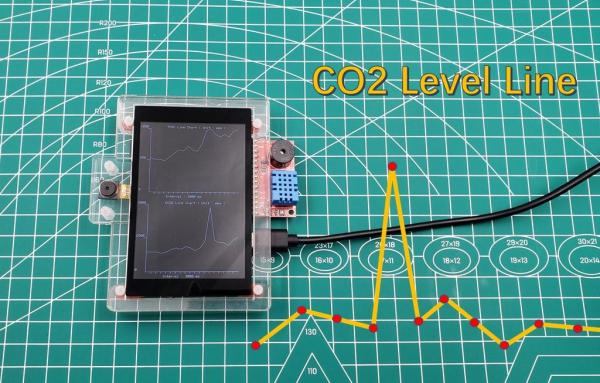
As the last project, I also used the SGP30 sensor to measure the CO2 concentration level. In order to convenient, I used an indoor environment board. This board base on the SGP30, also integrated the DHT11 module on board for measuring the temperature and humidity. Besides there is a buzzer on board for warning. Most importantly, it is can be used with my 3.5inch LCD device that I did not have to purchase the display and controller again. As the picture shown, the indoor environment board can be plugged into the device directly.
Step 3: Program
I have programmed the device again with Arduino. It would display the value which the sensor measured, also draw a curve with the historical values on the 3.5inch LCD. The Github link for the program: https://github.com/Makerfabs/Project_Touch-Screen-Camera/tree/master/example.
Step 4: Test
The CO2 would sink when the air was not flowing, I put the device in a place where the height is not so high, such as the desk. And it will be meaningless to put it on the ground. I tried to take a breathing, the CO2 concentration would raise to high level, and back to the normal after moments. If check the current level and ignore the history, it would cause a mistake that the high value is the current CO2 concentration level in the air. As long as check it with the line chart which drawn with the historical values, you can easily find that is an Inaccurate number. This curve will not fluctuate too much in normal.
Step 5: Expansion
Although this project is used to monitor the CO2 concentration level, it can be adjusted according to your wish to monitor TVOC, or temperature, or humidity. As the picture show, it collects two kind of values and draw its into the lines on the display.
Step 6: Final
This project not only displays the current CO2 value, but also displays the historical value and draws it into a line graph, so that people can more accurately distinguish the current CO2 level at a glance. I think that is very helpful for people who are concerned about CO2 level or studying changes in CO2 levels.
Source: Show CO2 Historical Level Curve With ESP32
- Why record historical CO2 levels?
Recording history is important because CO2 levels fluctuate due to factors like wind and breathing, making single moment checks inaccurate. - How does the project display data?
The device displays current sensor values and draws a curve with historical values on a 3.5-inch LCD. - What sensors are integrated on the board?
The indoor environment board uses the SGP30 for CO2 and integrates a DHT11 module for temperature and humidity. - Where should the device be placed for testing?
The device should be placed at desk height rather than on the ground where air flow is stagnant. - Can the project monitor other values besides CO2?
Yes, it can be adjusted to monitor TVOC, temperature, or humidity by drawing multiple lines on the display. - Does the line graph fluctuate significantly in normal conditions?
No, the curve drawn with historical values will not fluctuate too much under normal conditions. - What programming language was used for the project?
The device was programmed using Arduino. - Why is checking only the current level considered a mistake?
Checking only the current level causes mistakes because high values from momentary events like breathing may not reflect the actual air concentration.