I’ve had this planned for a while. The concept is to display the frequency of the UK mains electricity supply. This is meant to be 50Hz, but the frequency actually fluctuates around this value, as a result of changes to supply and demand.
If the frequency drops, it’s because demand has risen and/or supply has dropped, so generators have to work harder. This slows then down a bit, and the control systems take time to speed them back up.
If the frequency rises, it’s because demand has falled and/or extra supply has come on, so generators have to work less. This increases their speed a bit, and the control systems take time to slow them down.
So the frequency is constantly rising and falling. You can see a real-time graph of the last 60 minutes on the national grid website, and a nice real-time analog-style meter at the Dynamic Demand website.
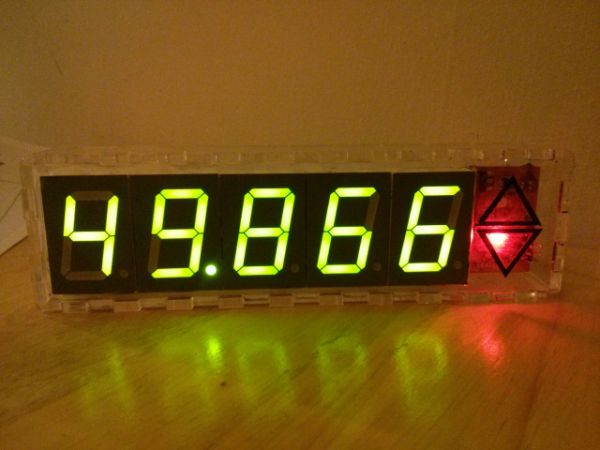
I wanted to make a display that could show the mains frequency to 3 decimal places. I’d be using the same seven-segment display modules that I used in my UNIX clock, so all I had to do was design the part that would work out the frequency.
There are lots of techniques to do this. My choice was to count a fixed number of mains frequency periods and time how long that takes to occur.
Here’s a drawing of the concept: The sine waves represent the mains. A high-frequency signal is run in parallel and used as a counter. The count after a fixed number of cycles is inversely proportional to frequency.
For example, if the frequency was exactly 50.000Hz, and I counted 200 periods, that would take exactly 4 seconds. If the frequency was actually 50.001Hz, 200 periods would only take 3.99992 seconds.
For more detail: Mains frequency display