Summary of DIY Arduino Board Water Meter
This article describes a DIY project by Teague to measure and analyze water usage in real-time. The team built four units using affordable components to monitor flow and temperature, transmitting data via WiFi to a server for visualization. A custom HTML5 tool named "Flow" displays usage patterns across various devices, enabling immediate feedback and long-term trend analysis to influence water consumption behaviors.
Parts used in the DIY Arduino Board Water Meter:
- INS-FM17N water meter by Koolance
- YellowJacket Arduino with built-in WiFi
- Thermistor (thermally-controlled resistor)
- Two fitting adapters
- Kitchen faucet connection setup
Working with the interaction design team, a bunch of us at Teague have been tinkering with measuring water, analyzing usage data in realtime to affect behaviors, and storing it to see patterns over time.
At the heart of the exploration was a need to cheaply measure water from the tap. Water meters vary quite drastically in price (from $250+ for industrial grade sensors to $6 for garden hose attachments that limit total usage based on rough estimates). We settled on a $20 water meter used for PC cooling systems (the INS-FM17N by Koolance) due to its accuracy, low price, small size, and electronic sensing method that could be easily measured by a microcontroller (such as an Arduino).
The meter comes with an electronic control box, but we found that integrating directly with the sensor was simple enough and saved us some additional wiring and space. As water passes through the flow meter, an impeller rotates and toggles an output line which can be used to calculate the amount of water used. In addition to measuring the quantity, we also included a thermister (thermally-controlled resistor) to sense temperature.
Since we wanted to have an internet connected data-stream of our water usage, we decided to try out the YellowJacket Arduino with built-in WiFi. Data was then sent to the server at regular intervals when the water source was in use (from 1-15 seconds depending on the wireless setup and resolution desired). Using a GET request with ID and usage information, the server was then able to store and retrieve sensor data. The complete circuitry and code (see download link below) were both conceptually straight-forward and easy to implement.
Over a quick 2-hour build session with the team, we created 4 working units. Each consisted of the WiFi Arduino, temperature sensor (shown on the right connected to the yellow wire), the flow meter, and two fitting adapters (for use in the shower). We also hooked one up to our kitchen faucet, which ended up providing the most interesting data due to its frequent usage throughout the day.
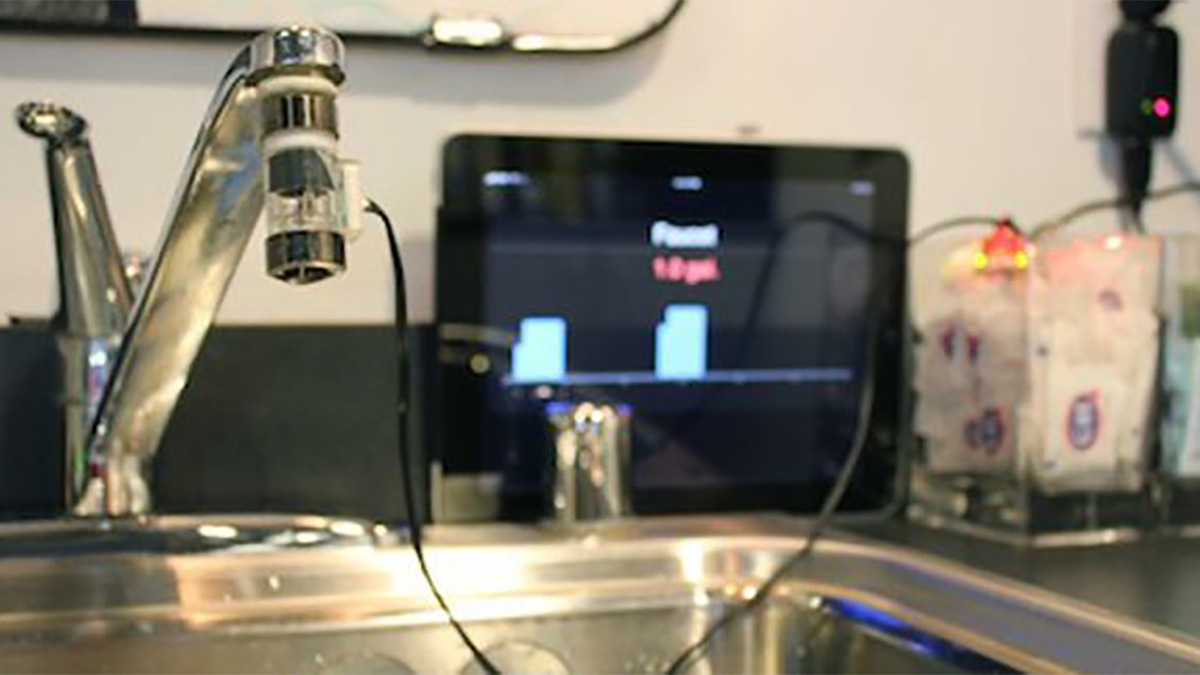
To visualize the data and make sense of water usage patterns over time, we also put together a simple HTML5 graphing tool, called Flow. Using a modular design, we were able to dynamically layout the content to fit screens of all sizes, from iPhone and iPads to laptops and projectors. This allowed us to place a small display next to the faucet for immediate feedback, while still offering us a more holistic view to compare multiple sources and look at first-order trends.
For more detail: DIY Arduino Board Water Meter
- Why did the team choose the INS-FM17N water meter?
The team selected this $20 meter for its accuracy, low price, small size, and electronic sensing method compatible with microcontrollers. - How is water flow quantity calculated in this project?
An impeller inside the meter rotates as water passes through, toggling an output line that calculates the amount of water used. - What component was added to sense temperature?
A thermistor or thermally-controlled resistor was included alongside the flow meter to sense temperature. - Which Arduino board was used for internet connectivity?
The YellowJacket Arduino with built-in WiFi was chosen to create an internet-connected data stream. - How often is data sent to the server?
Data is sent at regular intervals ranging from 1 to 15 seconds depending on the wireless setup and resolution desired. - What tool was created to visualize the collected data?
The team created a simple HTML5 graphing tool called Flow to display usage patterns over time. - Can the visualization tool be viewed on different screen sizes?
Yes, the modular design allows the content to dynamically layout for screens ranging from iPhones and iPads to laptops and projectors. - How many working units were built during the session?
The team created four working units during a quick 2-hour build session.