Many soil monitoring sensors are available, compatible with Arduino and other embedded modules, making them suitable for programming in different project domains, including Smart Agriculture Monitoring Systems. However, a challenge arises due to the lack of a standardized, versatile module that can be easily adapted to various projects and applications. In this endeavor, our goal is to develop a cost-effective, interconnected solution that includes a pre-assembled soil monitor built from a range of components. The development of this advanced project was made possible by the creation of low-power and compact PCB boards through PCBWay, and we will also provide insights into the process of designing and ordering these boards with PCBWay.
Within this project, our objectives encompass accomplishing the following:
- Having Soil sensor and the Microcontroller on a single board.
- 18650 Lithium battery-based system
- Reverse Polarity Protection for the battery
- USB Port to program, get a log or charge the battery
- Low power consumption
- Wi-Fi Connectivity
- Small size to be fit inside a 3D printed enclosure
- A ready to use and ready to manufacturing product
- Design the PCB
- Ability to increase the Soil probe current
Essential Components for Constructing a Soil Moisture Monitoring Device
The comprehensive Bill of Materials (BOM) is provided in the following inventory:
Qty | Value | Package | Parts |
1 | Pin Header – 0.254″ | 1X02 | JP1 |
1 | Jumper – 0.254″ | ||
1 | .1uF/50v | C0603 | C5 |
1 | 0.1uF / 6.3V | C0603 | C1 |
1 | 0.1uF / 6.3V | C0805 | C8 |
1 | 0R | R0805 | R6 |
1 | 1.25k | R0603 | R9 |
1 | 100R | R0805 | R11 |
1 | 100k | M0805 | R14 |
2 | 10k | R0603 | R12, R13 |
1 | 10k | R0805 | R10 |
1 | 10uF | C0805 | C4 |
1 | 10uF / 6.3V | C0805 | C7 |
4 | 12k | M0805 | R1, R2, R3, R4 |
1 | 12k | R0805 | R5 |
1 | 18650 BATTERY HOLDER | HOLDER | BAT1 |
2 | 2.2uFuF / 6.3V | C0805 | C2, C3 |
1 | 22.1k | R0603 | R15 |
1 | 2N3904 | SOT23 | Q1 |
1 | 2k | R0603 | R17 |
1 | 330R | R0603 | R8 |
1 | 47.5k | R0603 | R16 |
1 | 470pF/10V | C0805 | C6 |
1 | 629105136821 | USB-MICRO | J1 |
1 | 680R | R0603 | R7 |
1 | ESP-12E/F | ESP-12E | IC1 |
1 | LTC4054ES5-4.2#TRMPBF | SOT95P280X100-5N | U1 |
1 | MIC5219-3.3YM5 | SOT23-5 | IC3 |
2 | RED LED | CHIPLED_0805 | LED1, LED2 |
1 | SILABS_CP210 | SILABS_MLP28 | IC2 |
2 | SKRPABE010 | SKRPABE010 | SW1, SW2 |
1 | SRV05 | SC-74 | D1 |
1 | SS14 | DO-214AC | D2 |
2 | SS8050 | SOT23 | T1, T2 |
1 | Si2301 | SOT23-3 | Q2 |
Circuit Schematic for an Intelligent Plant Monitoring Device
The comprehensive diagram for the intelligent soil moisture monitoring device is presented below.
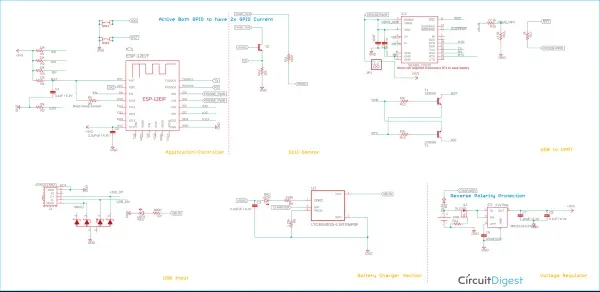
Let’s explore the connections of the components. To enhance clarity, we’ve divided the schematic into separate blocks, aligning with the operational principle of each major component.
Control Application
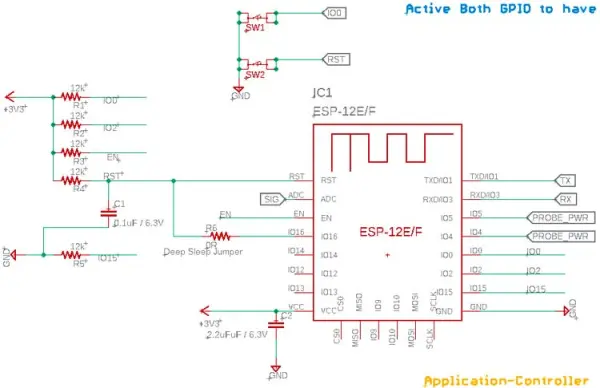
This is the ESP-12 microcontroller, which is programmed using the programmer. It’s a highly popular and cost-effective WiFi-based microcontroller with multiple pins. The R6 component is a 0-ohm jumper that serves to activate the deep sleep mode. There are four resistors for pull-up purposes connected to the IO0, IO2, EN, and RST pins. C1 and R4 form a time delay circuit to ensure a proper reset during each reset state or power-on mode. Additionally, there’s a pull-down resistor on the IO15 pin. The soil probe connects to two pins, IO5 and IO4. The TX and RX pins are linked to the UART to USB bridge. SW1 and SW2 are utilized for the RST and Boot modes. There’s also an ADC pin employed to gauge changes in the soil probe corresponding to variations in soil moisture levels.
The Sensing Probe
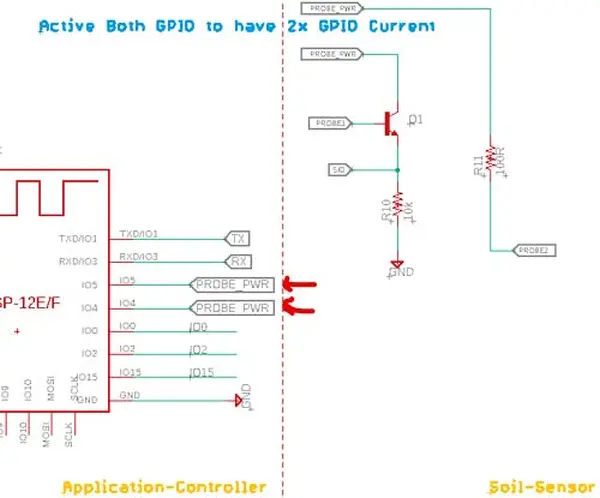
The Soil Monitor utilizes a pair of pins, IO5 and IO4, to collectively deliver a dual current (25mA x 2 = 50mA). Due to the minimal current variation, a transistor is employed to amplify the signal, resulting in a substantial number of alterations that can be detected by the ADC. This circuit design is adopted from the SparkFun Soil Probe.
UART to USB Conversion
In this context, the conversion of RX-TX to the USB port is necessary. This conversion is essential both for programming the module and for obtaining the necessary logs on the UART terminal during the development phase. To achieve this, we opted for the widely acclaimed CP2102 Module.
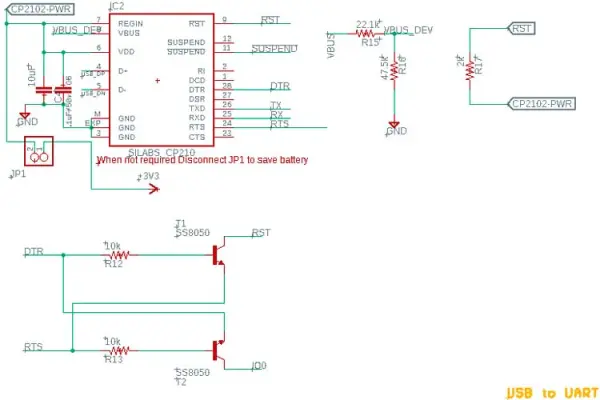
A jumper is employed to disconnect the CP2102 and its associated circuitry from the power supply, conserving battery power when the probe is utilized in an application rather than for development purposes. Nonetheless, regardless of the RST and BOOT switches, an automatically configurable logic, employing a transistor, is established in this setup to program the board with an auto-boot and reset capability.
The USB Input Segment
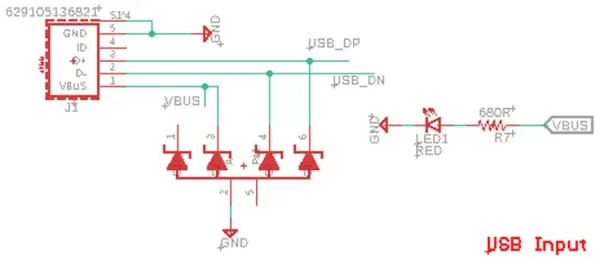
The USB input segment incorporates effective ESD protection mechanisms to safeguard the device from electrostatic discharge surges. The USB connector utilized in this configuration bears the part number 629105136821, which is the Wurth Elektronic Micro USB Port. Alternatively, a compatible USB port with a generic package can also be employed. Additionally, an LED indicator is integrated here to signal the presence of USB power.
Battery Charging Segment
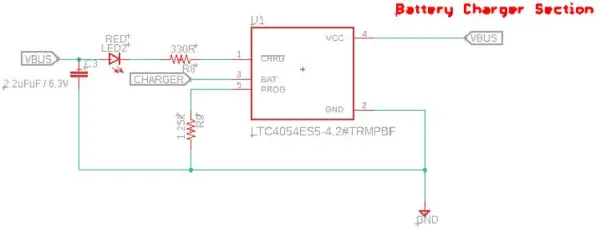
The lithium battery is charged using an Analog Devices IC, specifically the LTC4054ES5-4.2#TRMPBF, which is an 800mA, 4.2V battery charger. Resistor R9 is employed to deliver an 800mA charge current to the battery. An LED connected to the charge status pin serves as an indicator for the charging process. It remains continuously lit during the charging phase and extinguishes when the battery charging is finished.
Voltage Regulation Component
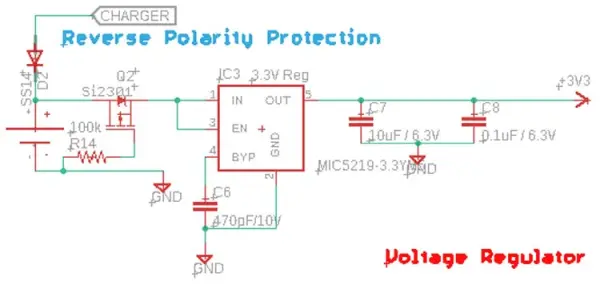
Because we are utilizing a 3.3V logic level controller and the battery operates within a voltage range of 3.7V nominal to 4.2V maximum, we require a voltage regulator to achieve the desired output voltage. In this context, we’ve selected the MIC5219-3.3V IC. The rationale behind this choice is its capacity to provide 500mA of current, precise load and line regulation, an extremely low dropout voltage, in addition to a 500mV output at 500mA and an ultra-low noise regulation feature. This component is readily available and is also cost-effective, making it an ideal low-dropout voltage regulator for our application.
Another critical consideration is safeguarding against reverse polarity. To address this, we’ve implemented a high-power P-channel MOSFET to offer seamless reverse polarity protection. Specifically, Q2 will activate only when the battery is correctly connected. If the battery is inserted in the wrong orientation, Q2 will deactivate and disconnect the entire circuit from the battery. Additionally, D2 is utilized to prevent reverse current flow into the charger. In cases where the USB is not plugged in, this diode significantly reduces battery leakage current. While the diode’s voltage drop may affect charging characteristics, it is an acceptable trade-off given its infrequent use due to the extended battery backup.
Manufacturing the PCB for the Plant Monitoring Device
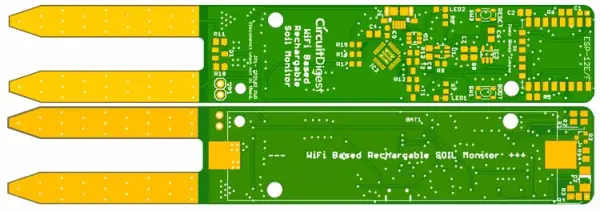
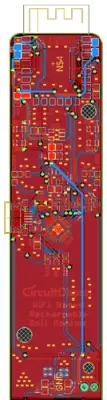
The PCB design has been completed based on the following specifications:
Displayed above is a 2D image of the PCB.
Particular emphasis should be placed on the Sensor Probe section –
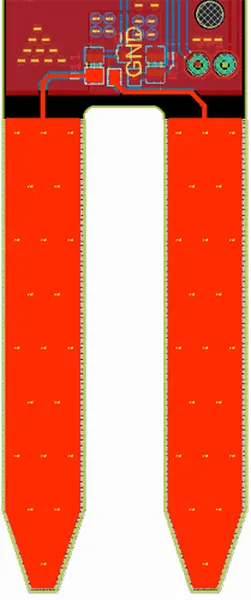
In this specific section, the solder mask layer has been deliberately omitted on both the top and bottom layers. To ensure robust connectivity on both layers, multiple vias have been interconnected. It is recommended, and if feasible, highly advantageous to opt for gold plating in this area. Doing so enhances connectivity by offering a low-resistance path through the gold mask. However, it’s important to note that this choice does come with a substantial increase in the PCB cost. For the sake of prototypes and testing, we have utilized a standard solder mask with SnPb.
Furthermore, it is recommended to avoid copper thickness less than 35um for this PCB.
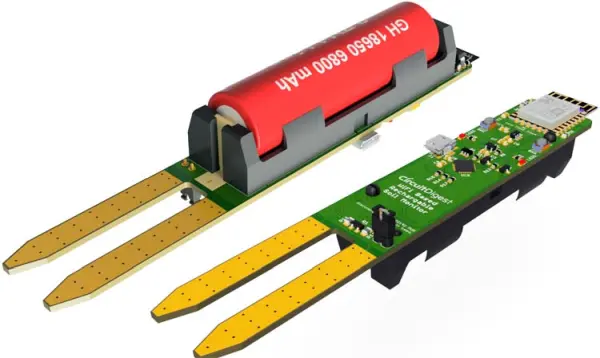
We have also adhered to the appropriate trace thickness for the 3.3V line, in accordance with IPC standards, to accommodate the 500mA of current flow. Taking into account the fact that both our battery traces and the USB input can supply 800mA of current, we have applied the same consideration to the VUSB (5V input) and battery traces. Ultimately, we generated 3D files and exported them in STEP format before fabricating the physical PCB to ensure that all components are correctly positioned and ready to fit inside the enclosure.
Please disregard the battery capacity; it is included solely for illustrative purposes.
Placing an Order for PCBs through PCBWay
Now that the design has been concluded, you can move forward with the PCB order:
Step 1: Access the PCBWay website and, if this is your first visit, register an account. Then, within the PCB Prototype section, input your PCB’s dimensions, layer count, and the quantity of PCBs you need.

Step 2: Continue by selecting the “Quote Now” button. You will be directed to a page where you can configure additional parameters such as board type, layers, PCB material, thickness, and more. Most of these options come pre-selected by default, but if you have specific preferences, you can make your selections here.
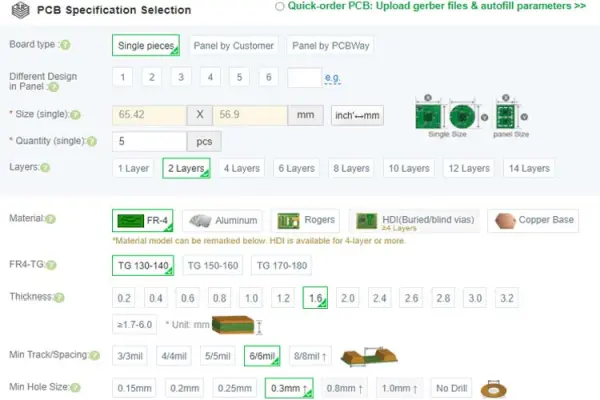
Step 3: The last stage entails uploading the Gerber file and completing the payment. PCBWay conducts a validation check on your Gerber file to ensure its validity before allowing you to proceed with payment. This procedure ensures that your PCB is compatible with the fabrication process and will be delivered as promised.

Assembling the PCB
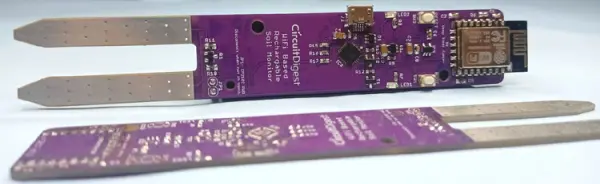
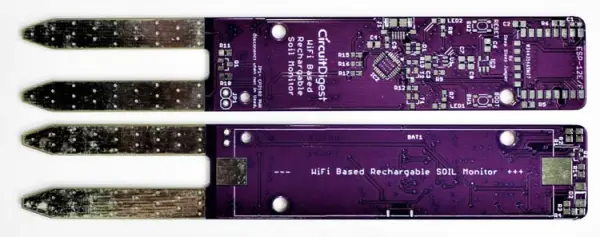
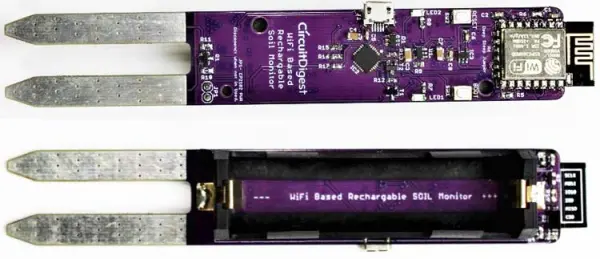
Following the placement of the board order, it was delivered to me via courier within a few days, neatly packaged in a well-labeled box. The PCB quality met expectations, as usual. Below, you can see both the top and bottom layers of the board:
Once I had confirmed that the tracks and footprints were accurate, I moved forward with the PCB assembly. Here is an image of the fully soldered board:
Adafruit IO Setup
Adafruit IO serves as an open data platform, enabling the consolidation, visualization, and analysis of real-time data in the cloud. By utilizing Adafruit IO, you gain the capability to upload, showcase, and oversee your data through the internet, transforming your projects into IoT-enabled solutions. With Adafruit IO, you can manage motors, access sensor data, and craft intriguing IoT applications that operate seamlessly over the internet.
In order to utilize Adafruit IO, the initial step involves creating an account on the Adafruit IO platform. To achieve this, navigate to the Adafruit IO website and click on the “Get started for Free” option located in the top right corner of the screen.

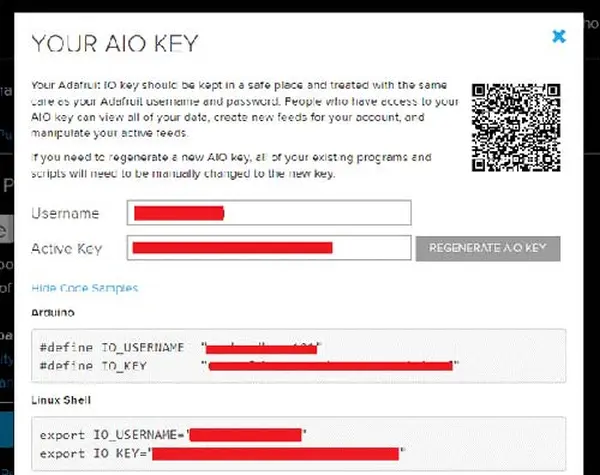
Once you have completed the account registration, log in to your account and access your account username and AIO key by clicking on “View AIO Key” located in the top right corner.

Clicking on “AIO Key” will trigger a pop-up window displaying your Adafruit IO AIO Key and username. Copy both the key and the username, as you will require them later in your code.
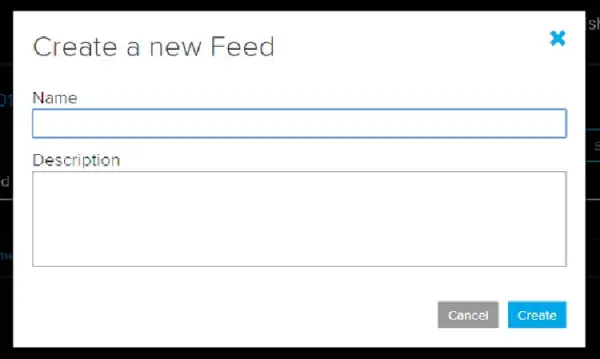
Next, you’ll need to establish a feed. To do so, select “Feed,” then go to the “Actions” menu, where you will find various options. Among these options, choose “Create a New Feed.”

Following this step, a new window will appear where you should input the Name and, optionally, a Description for your feed. Once this information is provided, click on “Create,” and you will be directed to the feed you’ve just established.
After the feed is created, the next step involves setting up an Adafruit IO dashboard to visualize these readings in a graph.
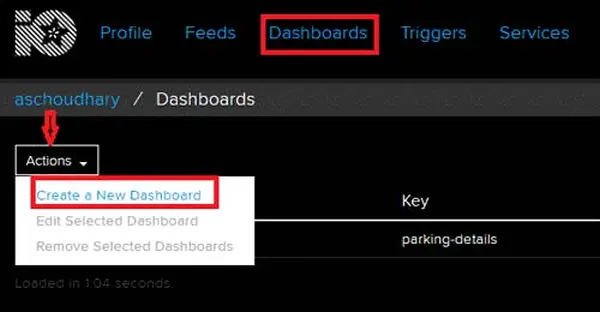
To generate a dashboard, access the Dashboard section, then proceed to the “Actions” menu, where you can select “Create a New Dashboard.” In the subsequent window, provide a name for your dashboard and click on “Create.”
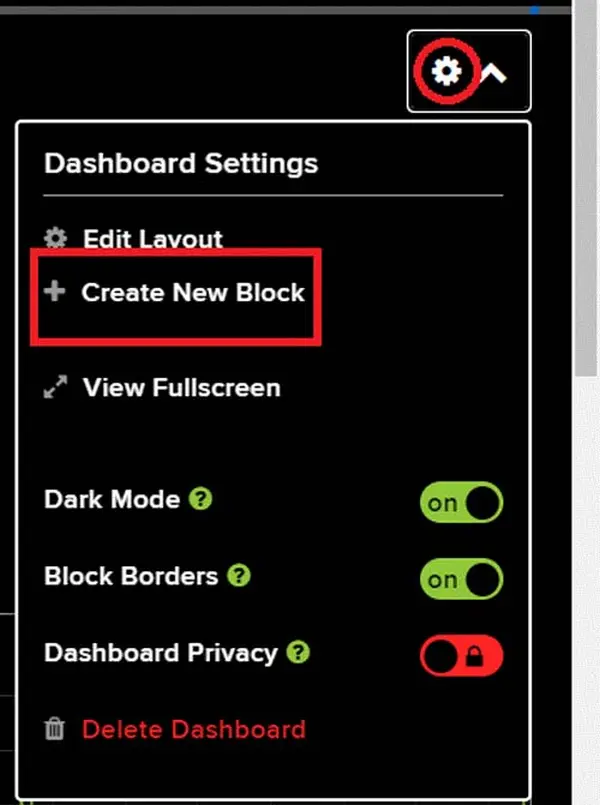
The dashboard has been successfully created. Now, we will incorporate the ‘Line Chart’ block into it. To add a block, click on the ‘Gear’ icon located in the top right corner, then choose ‘Create New Block.’ In the subsequent window, select the Line Chart block and the specific Feed from which you wish to display the data.
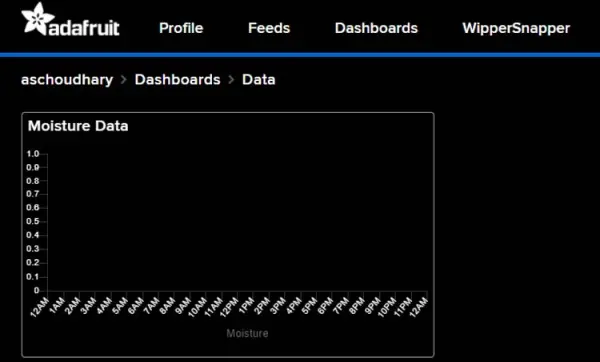
The completed dashboard will have this appearance:
Programming the ESP-12E
The comprehensive code for the Smart Plant Monitoring Device can be found towards the conclusion of this document. In this section, we will elucidate crucial segments of the code. The code relies on the Adafruit_MQTT and ESP8266WiFi.h libraries. You can obtain the Adafruit_MQTT.h library from the provided link, while the ESP8266WiFi.h library is automatically included with the ESP board package installation.
Once you’ve successfully installed the libraries in the Arduino IDE, initiate the code by incorporating the necessary library files.
#include <ESP8266WiFi.h>
#include “Adafruit_MQTT.h”
#include “Adafruit_MQTT_Client.h”
In the subsequent lines, input the Wi-Fi and Adafruit IO credentials that you had previously copied from the Adafruit IO server. This information should encompass the MQTT server, Port No, User Name, and AIO Key.
Const char *ssid =  “Wi-Fi Name”;
const char *pass =  “Password”;
#define MQTT_SERV “io.adafruit.com”
#define MQTT_PORT 1883
#define MQTT_NAME “Usernae”
#define MQTT_PASS “Password”
Adafruit MQTT serves a dual purpose: data can be both published to and subscribed from the broker. In this context, we will be publishing data to the broker. To do so, we start by establishing an Adafruit_MQTT_Client mqtt() object, followed by configuring the Adafruit IO feed to store the sensor data.
Adafruit_MQTT_Client mqtt(&client, MQTT_SERV, MQTT_PORT, MQTT_NAME, MQTT_PASS);
Adafruit_MQTT_Publish Moisture = Adafruit_MQTT_Publish(&mqtt,MQTT_NAME “/f/Moisture”);
Within the moisture() function, our initial step involves retrieving moisture data from the soil moisture sensor, which is linked to the A0 pin of the ESP. Subsequently, these readings are transformed into a percentage format, and finally, the data is transmitted to the Adafruit IO feed.
Void moisture() {
  MQTT_connect();
  moisturePercentage = ( 100.00 – ( (analogRead(moisturePin) / 1023.00) * 100.00 ) );
  Serial.println(“Soil Moisture is  = “);
  Serial.println(moisturePercentage);
  Serial.println(“%”);
  delay(900);
  Moisture.publish(moisturePercentage);
}
Next in line is the void loop(). This is where all the operations are executed. Within this loop, the initial action is to invoke the moisture() function for obtaining sensor data and transmitting it to Adafruit IO. Ultimately, the crucial function to be called is ESP.deepSleep(). This function places the module into a sleep state for the specified duration, which is set to 1 hour in this instance.
Void loop() {
  moisture();
  delay(3000);
  Serial.println(“deep sleep for 1 hour”);
  ESP.deepSleep(3600e6);
}
Testing the Smart Plant Monitoring Device
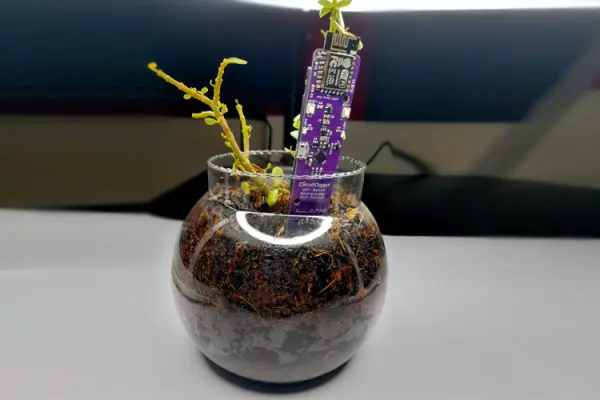
With all the preparations completed, the final stage is to place this device inside a plant pot and observe its performance. However, prior to that, let’s begin by uploading the code to the ESP-12E. To do this, connect the USB cable to the micro-USB port on the device, choose ‘Generic ESP8266 Module’ as the board type, select the appropriate port number, and then click the upload button.
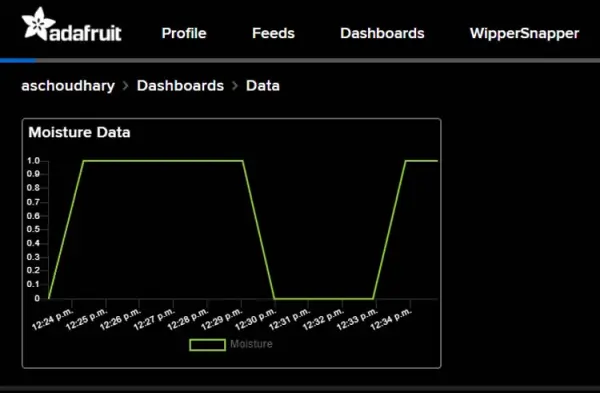
The device has been configured to gather sensor data, share it on Adafruit IO, and subsequently enter Deep Sleep mode for a duration of one hour. The Adafruit IO platform will exhibit the soil moisture measurements.
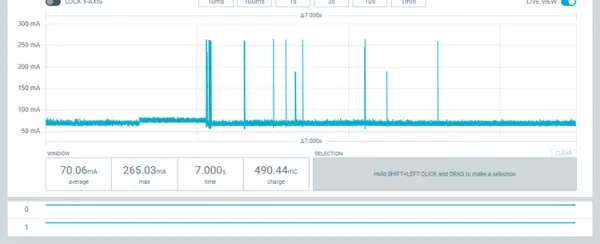
To determine the battery’s operational duration, we conducted measurements of current consumption in both normal mode and deep sleep mode using the Nordic Power Profiler Kit II. In the graph below, you can observe that the current consumption in normal mode registered at 70mA.
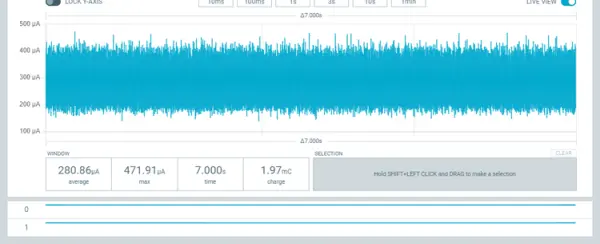
Furthermore, the average current consumption in deep sleep mode amounted to 280 µA.
These readings were employed in the calculation of battery runtime. The calculations are presented as follows:
During wake mode, the device draws a current of 70 mA for approximately 10 to 12 seconds every hour, which amounts to 288 seconds or roughly 5 minutes per day. For the remaining 23 hours and 55 minutes, the device remains in a sleep state.
Hence, the cumulative current consumption will be:
The overall current usage equals the current drawn during wake mode plus the current utilized during sleep mode.
Ttotal = 0.005A + 0.00669A = 0.01169

Battery Run Time = Battery Capacity (2600mAh) / Current Consumption (0.01169A)= 2.6 Ah/ 0.01169 = 222 Days
These calculations are performed as approximations, providing an estimate of the battery’s operational duration. That concludes the video, which offers a comprehensive explanation of the circuit, code, and its functioning. If you have any inquiries, kindly leave them in the comments section or feel free to initiate a discussion on our forum.
Code
#include <ESP8266WiFi.h>
#include "Adafruit_MQTT.h"
#include "Adafruit_MQTT_Client.h"

const int moisturePin = A0;  // moisteure sensor pin
const int probe1 = 5;
const int probe2 = 4;
float moisturePercentage;              //moisture reading

const char *ssid =  "Galaxy-M20";     // Enter your WiFi Name
const char *pass =  "ac312124"; // Enter your WiFi Password

WiFiClient client;
#define MQTT_SERV "io.adafruit.com"
#define MQTT_PORT 1883
#define MQTT_NAME "aschoudhary" // Your Adafruit IO Username
#define MQTT_PASS "1ac95cb8580b4271bbb6d9f75d0668f1" // Adafruit IO AIO key

Adafruit_MQTT_Client mqtt(&client, MQTT_SERV, MQTT_PORT, MQTT_NAME, MQTT_PASS);
Adafruit_MQTT_Publish Moisture = Adafruit_MQTT_Publish(&mqtt,MQTT_NAME "/f/Moisture");  // Moisture is the feed name where you will publish your data

const unsigned long Interval = 50000;
unsigned long previousTime = 0;

void setup()
{
  Serial.begin(9600);
  delay(10);
  pinMode(probe1, OUTPUT);
  pinMode(probe2, OUTPUT);
  digitalWrite(probe1, HIGH);
  digitalWrite(probe2, HIGH);
  Serial.println("Connecting to ");
  Serial.println(ssid);
  WiFi.begin(ssid, pass);
  while (WiFi.status() != WL_CONNECTED)
  {
    delay(500);
    Serial.print(".");              // print ... till not connected
  }
  Serial.println("");
  Serial.println("WiFi connected");

}

void moisture()
{
  MQTT_connect();
  moisturePercentage = ( 100.00 - ( (analogRead(moisturePin) / 1023.00) * 100.00 ) );
  Serial.println("Soil Moisture is  = ");
  Serial.println(moisturePercentage);
  Serial.println("%");
  delay(900);
  Moisture.publish(moisturePercentage);
}

void loop()
{
  moisture();
  delay(3000);
  Serial.println("deep sleep for 1 hour");
  ESP.deepSleep(3600e6);
}

void MQTT_connect()
{
  int8_t ret;
  // Stop if already connected.
  if (mqtt.connected())
  {
    return;
  }
  uint8_t retries = 3;
  while ((ret = mqtt.connect()) != 0) // connect will return 0 for connected
  {
       mqtt.disconnect();
       delay(5000);  // wait 5 seconds
       retries--;
       if (retries == 0)
       {
         // basically die and wait for WDT to reset me
         while (1);
       }
  }
}