[email protected], January 2021
Here, we propose an open-source, portable, autonomous, cheap and easy-to-use device to monitor and record the concentration of CO2 in ambiant air in real-time. Using CO2 as a proxy for respiratory aerosols, the device can help define best practices regarding the ventilation of closed space (an important anti-Covid19 measure).
Starting from early 2020, the advent of the Covid19 pandemic has had a profound impact on the daily lives of billions of people. The perspective of active vaccines becoming available as soon as early 2021 has shone a ray of light on an otherwise dire situation. However, it is expected that as much as 70% of a country’s population will have to be vaccinated in order to stop the spreading of the virus there. Even for countries with excellent medical infrastructures, reaching this aim represents a difficult and uncertain challenge.
Under such circumstances, the different measures that have been taken worldwide against the spreading of the virus (such as social distancing, frequent hand washing, wearing of respiratory masks, and so on and so forth) will have to be maintained for many more months, possibly even years. Any new strategy, information or technological solution that may help fight the virus, besides vaccines, can therefore have a large-scale and lasting impact.
In this tutorial, we try to address an issue that is both simple and very complex: the efficient ventilation of closed spaces occupied by people. SARS-CoV2, the virus responsible for Covid19, is considered to be an airborne virus, spreading (among other ways) through respiratory aerosols (microscopic droplets that are expired as a normal byproduct of respiration). Outdoor or in largely open spaces, the best mitigating strategy against aerial contamination remains distancing: maintaining a distance of one to two meters between people is considered to be an easy way to safeguard against virus exchange through aerosols. By contrast, in closed spaces, respiratory aerosols have been shown to travel over large distances and to diffuse uniformly in whole rooms when given enough time. Under such circumstances, distancing loses part of its efficiency, and the breathable air in the whole room is at risk of becoming a contamination vector. Remediation against this problem is easy, in principle: ensuring a good ventilation of closed spaces solves the problem. However, what makes the problem difficult is the lack of obvious metrics on which to rely in order to choose the best ventilation strategy: for a given number of people in a given closed space, how often should windows or doors be open, and for how long ?
We propose using the monitoring of CO2 as a proxy to provide a quantitative measurement of how much breathable air in a room is potentially charged with respiratory aerosols.
Trying to detect directly the microscopic droplets responsible for aerial contaminations, while technically feasible, would prove absurdly complex and expensive under normal, day-to-day conditions. However, considering that said aerosols are a direct byproduct of the respiration of the people present in the room, they can indirectly be monitored through another natural product of respiration: carbon dioxide. By dosing carbon dioxide in a room occupied by people and comparing that measurement with the local background atmospheric CO2 concentration (usually around 400 ppm on average), one gets a direct estimate of how much air has been “breathed out” by the occupants. Based on that measurement, a sound ventilation strategy can then be experimented on and monitored, ensuring a safer occupation of closed spaces.
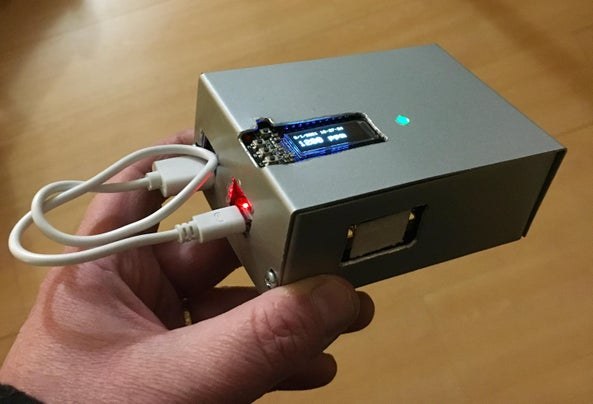
The “heart” of the device we propose here is an infrared CO2 sensor piloted by an Arduino-compatible microcontroller, to which are added a visual interface and a logging device enabling the continuous recording of CO2 levels on micro-SD cards. The device continuously measures, records and displays the date, time and the CO2 concentration in ppm. An RGB LED next to the screen indicates three possible states of operation: Blue when the device is preheating, green when the CO2 concentration is below the user-chosen threshold and red when it exceeds that threshold. Three buttons next to the screen allow users to select their chosen threshold, the default value being 1000 ppm (as per the recommendation of most international health agencies).
Supplies
- Gravity NDIR CO2 Sensor (SEN0219)
- Adafruit Feather 328P or any similar Arduino-compatible microcontroller ( Feather M0, M4, 32u4, …)
- Adafruit Featherwing Adalogger or any separate SPI SD Card and I2C RTC boards
- Adafruit Featherwing OLED 128×32 or any I2C-addressable OLED screen
- Stacking Headers and Male Headers
- Micro-SD Card
- 5 mm RGB LED (common cathode type)
- 120 Ohms resistor
- USB Power Bank (of 1500 mAh capacity or more)
- Short USB A – Micro-USB Cable
- CR1220 Battery
- Electric Wires and Heat Shrink Tubing
- Any kind of box (size determined by Power Bank)
Estimated total cost as of January 2021: around 100 Euro / 120 USD
The Feather 328P microcontroller listed above is the equivalent of an Arduino board, adapted here to the Feather form factor and running on 3.3 V logic tension. If size is not an issue (for instance for fixed devices), then it can be replaced by any basic Arduino board. The requirement for any replacement board for this project is that the chosen microcontroller be capable of communicating with peripherals through both SPI and I2C, while also having at least one analog input pin associated to an ADC (ideally with a range over 2V).
Any Arduino-compatible Feather may be used instead of the 328P model listed here, like, for instance, a Feather M0 board, an M4 or 32u4 board, or any other model. The rationale behind the particular choice of model 328P is simply cost, this model being the cheapest existing Feather board (as of the writing of this guide).
Featherwings are the equivalent, for Feather boards, of “Shields” in the Arduino ecosystem. If you would rather substitute a classical Arduino board to the Feather 328P, then similarly, the listed Featherwings will have to be replaced by equivalent shields or separate boards.
As its name suggests, the Featherwing OLED is a small OLED screen, which communicates through I2C. An interesting feature of the particular model recommended here is the presence of three buttons (A, B and C), which are used here to interact with the device’s interface. They can easily be replaced by independent push-buttons if needed.
The Featherwing Adalogger is the combination of an I2C RTC and a SPI SD Card reader. It is used here to record measurements and their corresponding time and date.
The power bank can be replaced by a Micro-USB phone charger of any type, in case the device is used as a fixed apparatus plugged to a wall socket. Note that USB power banks generally come with their own USB A – Micro-USB cable (beware: in most cases, such battery cables only have power wires, and cannot be used for programming or for data transfer). Similarly, products like the Feather microcontroller or its Featherwings are generally sold with appropriate male headers. If however you want to stack the two Featherwings on top of the Feather board, long stacking female headers are required.
Step 1: Assembling the Micro-Controller (Feather) and Its Shields (Featherwings)
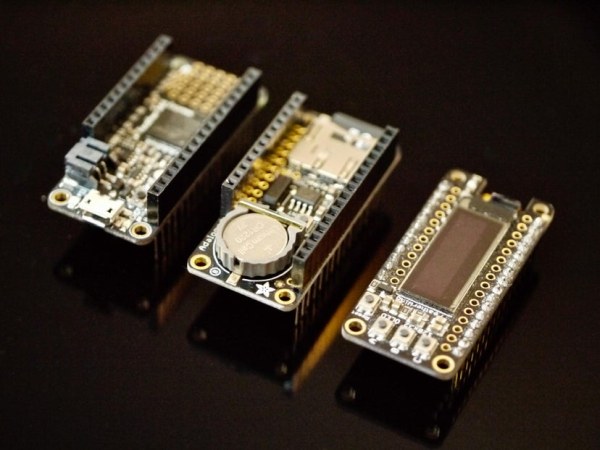
The very first task required is to install headers on the Feather microcontroller and on the two Featherwings. The three PCBs can then be stacked or placed alongside one another on an electronic breadboard, perfboard or Featherwing Tripler. For the latter solutions, equipping each board with the simple male headers that come with it is enough. For stacking boards (a more compact and more practical design), female long stacking headers must be used. Note that whatever the configuration you select, the OLED Featherwing always requires male headers, being on top of the pile.
Headers are installed by soldering them to the corresponding holes in each board. Some distributors allow the purchase of boards with pre-soldered headers. Be cautious however about the type of headers that are installed by default: most of the time, they are classical male headers, adapted to breadboards but not made to stack boards on top of one another.
Once the three boards are all equipped with their corresponding headers, you need only stack them and the whole set is ready to receive the dedicated code.
Step 2: Uploading the Code and Testing the Stacked Boards
Now that the boards are stacked, you can connect the microcontroller’s Micro-USB socket to your computer using the USB A-Micro-USB cable.
Caution: For this step, you should NOT use the cable that came with the USB power bank. Indeed, in order to reduce costs, most of these cables are made with just power wires and no data line. Using such cables, your computer will correctly power the boards but fail to detect them as active components.
Important preliminary step: The Adalogger Featherwing has two functions: It operates the micro-SD card and provides time with an RTC (Real-Time Clock). Before you upload the operating code to the Feather board, it is important that you initialise the RTC with the current time. This needs to be done only once in the lifetime of the device (or, more precisely, in the lifetime of the Adalogger’s Featherwing battery, namely, several years). In order to do that, you have to insert a brand new battery in the Adalogger Featherwing and then upload and run a specific code on the Feather board. The code in question can be found in the Examples menu of the Arduino IDE, under the RTClib menu. It bears the name of the RTC you are using, which, in the case of the Adalogger board, is pcf8523. Once you upload and run this code (you may need to open the serial monitor for that), the clock in the Adalogger is set to the current time as defined by your computer. It will stay synchronised to that time for as long as the battery runs.
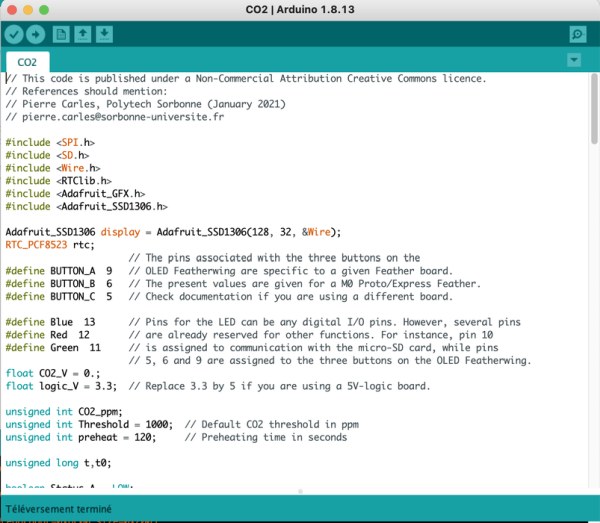
Uploading the final code: Once the RTC is initialised, you can upload the operating code to the Feather board.
The code proposed here is written for the Arduino IDE. The Arduino IDE language is derived from C/C++. The code is abundantly commented. It relies on the following libraries, which you should first import into the Arduino IDE using its Library Manager:
- SPI
- SD
- Wire
- RTClib
- Adafruit_GFX
- Adafruit_SSD1306
The code can be downloaded from the following GitHub repository:
https://github.com/laphysiqueaveclesmains/Covid-19…
The structure of the code is simple:
- When the device is turned on, a two-minute pre-heating phase begins, during which the LED glows blue.
- The file in which CO2 levels are recorded is created on the micro-SD card. The filename is automatically generated on boot as LOG*****.TXT, where ***** in a unique, 5-digits indexing number growing with time. This number indexation makes the time ordering of files easy and protects the system against involuntarily over-writing older files if the device is rebooted.
- Then begins the normal operation cycle, in which a measurement of the CO2 concentration is made every two seconds. After a series of five such measurements, the estimated value for CO2 concentration is calculated as the average of the preceding five values. It is then recorded on the micro-SD card along with date and time and similarly displayed on the OLED screen.
- The displayed CO2 concentration is compared to a user-defined threshold. If it exceeds the threshold, the LED turns to red, otherwise, it turns to green.
- A new measurement cycle then starts again.
- In-between two measurements, the code checks wether the A button is pressed. If it is, the display changes to a menu through which the user can increase of decrease the chosen threshold by steps of ± 250 ppm, using buttons B and C. The default threshold is fixed at 1000 ppm, as per the recommendation of several international health organisations.
Step 3: Building the Circuit
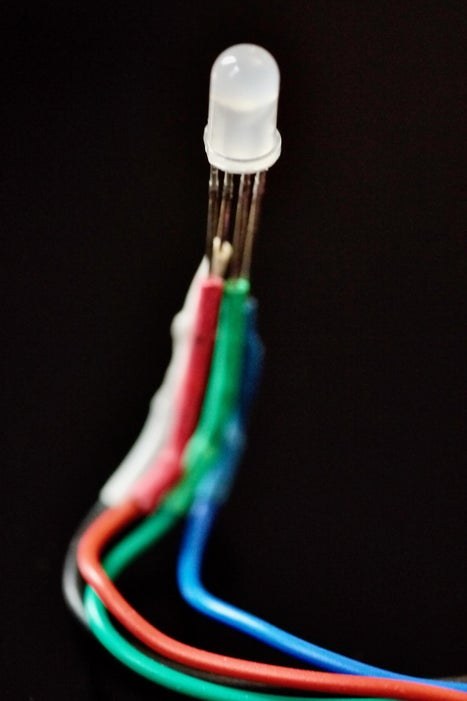
The circuit layout is reasonably simple. The three stacked boards naturally connect where needed, and only the LED and the CO2 sensor require wired connexions.
The LED is connected here to digital I/O pins number 13 (R), 12 (B) and 11 (G), while its common cathode is connected to ground. Other pins can be selected, but this particular choice was motivated by the need to avoid using pin 10, which is already affected to SPI hardware communication between the microcontroller and the Adalogger board. Besides, on Feather boards (and most Adafruit boards), pin #13 is connected to the debug red SMD LED present on the board itself. With the present wiring choice, the red channel of the external RGB LED always mimics the red board LED, which can be convenient for debugging purposes. Generally speaking, it is important that you check precisely which pins are used by defaults by the shields or Featherwings that you connect to with your main board, in order to avoid conflicts.
The CO2 sensor chosen here is an infrared NDIR CO2 sensor made by Gravity. Several other models exist on the market, although most are more expensive than this one. This particular model provides an analog output with a tension varying from 0 to 2V. This output is connected to pin A2 on the board. That pin is used as an analog input, and an instruction in the code activates its 12-bit ADC resolution (as compared to the 10-bit ADC of classical Arduino). The choice of A2 here, once again, is made in order to let other potentially important analog pins free. More specifically, we tried to avoid using pins A0 and A1, which are associated with two DACs on many Feather boards, in case you need them for another purpose. Finally, the power wires of the sensor are connected to the USB and ground pins of the Feather board, respectively. The reason for that is the requirement of a 5V tension for powering the sensor (Feather boards run on 3.3V logic tension).
The circuit on the picture above shows no power source. The choice of simplicity for this design led us to recommend using a micro-USB power supply or a micro-USB power bank, both of which can be plugged directly into the Feather board. In that way, no boost circuit board is needed to accommodate the sensor requiring a 5V input current to the 3.3V Feather board. After extensive tests, we have observed that a 2000 mAh power bank allows the device to run continuously for slightly more than 24 hours.
Since the main board and its two shields are stacked, the pins on the board are not directly accessible for soldering wires. There are several ways around this minor inconvience:
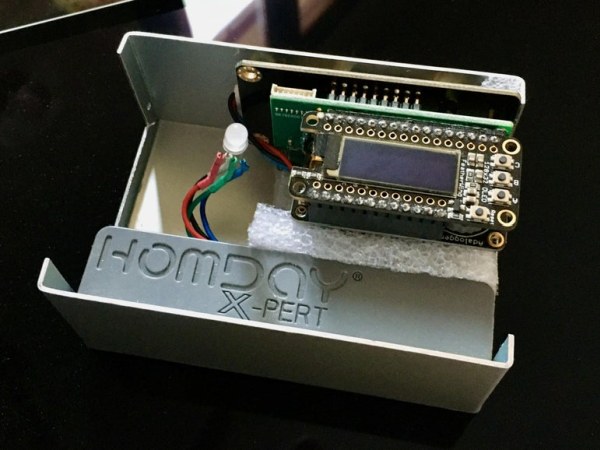
- If long female stacking headers were installed on the Feather board (like on the photograph here), then connections can easily be soldered on the part of the pins that protrude from the bottom of the board.
- Most Featherwing boards come with a double row of pins, which are meant to allow the user to connect wires to pins while still ensuring stacking through the headers (see photograph).
- The Feather board can itself be soldered on a small perfboard (for instance of the Permaproto type), on which other wires can then be easily soldered.
Step 4: House the Device and the Power Bank in a Box
Once everything is wired and connected, the only remaining thing to do is to find a box of an appropriate size, to make holes in it wherever needed and finally to secure all the electronic components and the power bank inside. An easy and serviceable way to fix them is to use mirror double-sided self-adhesive foam, which often comes in rolls.
Voilà ! Your CO2 monitor is ready !
Step 5: Important Note
The device built here is small, owing to deliberate design choices. One reason for this is that of autonomy: The CO2 monitor here is meant to be portable, allowing the user to carry it easily from one room to another or even outside. Affixing magnets to the side opposite to the OLED allows the device to be easily positioned in typical rooms, relying on metallic surfaces. It is generally recommended that indoor CO2 sensors be placed at a height between 1 and 1.5 meters, away from doors and windows.
With such a small size, the visual clues informing the user of an excess CO2 concentration (i.e. the LED turning red and the ppm figure exceeding the chosen threshold) are relatively discreet. This could seem like a poor design choice, if the aim is to warn people of the need for a ventilation action. However, on the contrary, the relative smallness of the CO2 indications are also a deliberate design choice. Indeed, several months of joint work with the Faculty of Medicine of Sorbonne University in Paris (for which we have developed this device) have taught us that actions of prevention regarding viral contamination should always be thought out in a global manner, which includes the potential for inappropriate and anxiety-inducing messages. For instance, a large, flashing display announcing that CO2 levels are too high would definitely qualify as an anxiety-inducing device that could, in the long run, become counter-productive, by deterring people from entering the corresponding spaces altogether or creating unneeded tensions. Ventilation actions take minutes, while the building of CO2 in a room due to breathing typically takes tens of minutes or more. Under such conditions, and given that the risk of aerial contamination remains small even in closed spaces provided people wear masks, treating ventilation actions as an immediate emergency would be excessive.
The present device must therefore be viewed as an objective way to determine quantitative ventilation guidelines for ensuring the safest possible air quality in closed spaces. It should preferably be monitored by one designated person in the group rather than be used as a public signal.
Stay safe, and let me know if you build one !
Step 6: Scientific References
- The Fluid Mechanics of Natural Ventilation, P. F. Linden, Annu. Rev. Fluid Mech. 1999. 31:201–38
- Indoor Air Quality in a Middle School, Part I: Use of CO2 as a Tracer for Effective Ventilation, P. A. Scheff, V. K. Paulius, S. W. Huang, L. M. Conroy, Applied Occupational and Environmental Hygiene Volume 15(11): 824–834, 2000
- Ventilation for Acceptable Indoor Air Quality, ANSI/ASHRAE Standard 62-2001 (2001)
- Modality of human expired aerosol size distributions,
- G.R. Johnsona et al., Journal of Aerosol Science 42 (2011) 839–851
- Airborne Transmission of Influenza Virus Infection in Mice, L. Teiwme, E.D. Schulman, F. Kilbourn, Nature, September 15, 1962 voL. 195
- Aerosol Transmission of Infectious Disease, R.M. Jones and L. M. Brosseau, JOEM Volume 57, Number 5, May 2015
- Effect of ventilation improvement during a tuberculosis outbreak in underventilated university buildings, C.R. Du et al., Indoor Air, 2020, 30:422–432
- Defining the sizes of airborne particles that mediate influenza transmission in ferrets, J. Zhou et al., PNAS vol. 115, no. 10 (2017)
- SARS-CoV-2 is transmitted via contact and via the air between ferrets, M. Richard et al., Nature Communications, (2020)11:3496
- Airborne Transmission of SARS-CoV-2, K. A. Prather et al., Science 10,1126 (2020)
- Estimation of airborne viral emission: Quanta emission rate of SARS-CoV-2 for infection risk assessment, G. Buonannoa, L. Stabilea, L. Morawskab, Environment International 141 (2020) 105794
- Effects of ventilation on the indoor spread of COVID-19, R.K. Bhagat1, M.S. Davies Wykes, S.B. Dalziel, P.F. Linden, J. Fluid Mech. vol. 903 (2020)
- Persistence of Severe Acute Respiratory Syndrome Coronavirus 2 in Aerosol Suspensions, A. C. Fears et al. , CDC Dispatch, Volume 26, Number 9—September 2020
- Airborne Transmission Route of COVID-19: Why 2 Meters/6 Feet of Inter-Personal Distance Could Not Be Enough, Leonardo Setti et al. Int. J. Environ. Res. Public Health 2020, 17, 2932
- Aerosol and Surface Stability of SARS-CoV-2 as Compared with SARS-CoV-1, N. van Doremalen et al., N. Engl. J. Med. 382, 16, 2020
Source: CO2 Monitoring As an Anti-Covid19 Measure