
Summary of Multi-Sensor Data Plotting using Arduino IDE
This article details a real-time temperature monitoring system using Arduino IDE to graphically display data from multiple sensors. The setup utilizes an Arduino Uno board interfaced with two LM35 precision temperature sensors connected to analogue input pins A0 and A1. The system reads voltage outputs proportional to Celsius temperatures, converts them via the Serial Plotter function in the IDE, and visualizes live trends on a monitor for industrial process control applications.
Parts used in the Real-Time Temperature Monitoring System:
- Arduino Uno board (AVR ATmega328P microcontroller)
- LM35 precision temperature sensor (Sens1)
- LM35 precision temperature sensor (Sens 2)
- Computer running Arduino IDE version 1.6.12 or higher

Monitoring of various process variables such as temperature, pressure, viscosity, humidity, pH and flow-rate is very important in steel plants, petrochemical and other such industries. The human-machine interface (HMI) at the operator station displays a continuous and real-time trending of process variables on a monitor for viewing by the control room personnel.
This project describes the method of monitoring live temperature data graphically from multiple sensors in real time using Arduino IDE. Fig. 1 shows the graphical user interface (GUI) window along with plots of live temperature data from two on-field temperature sensors.
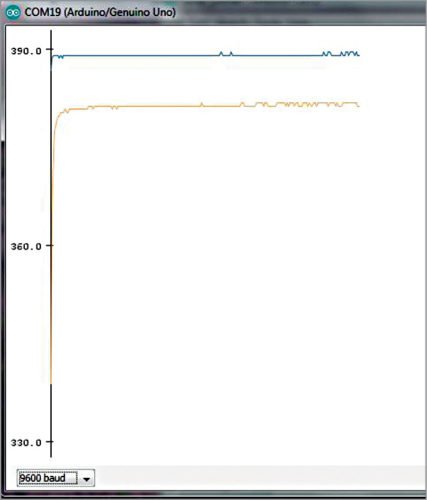
GUI window with live temperature plot
Circuit and working
Block diagram for this project is shown in Fig. 2 and the circuit diagram in Fig. 3.
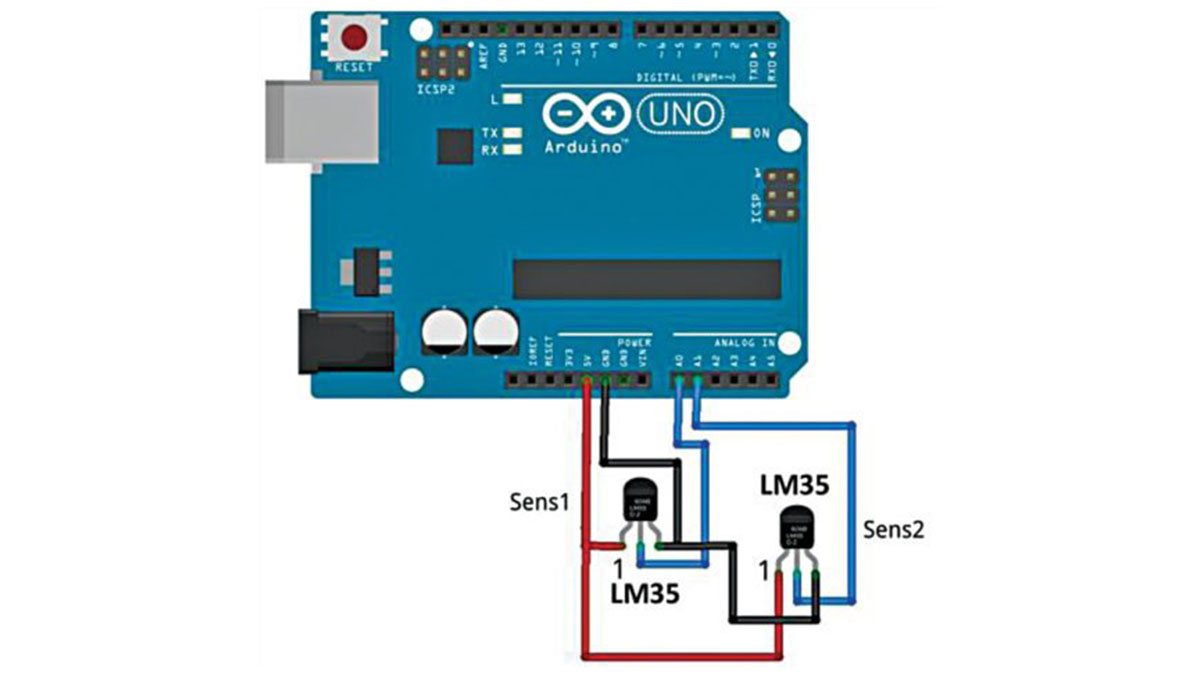
Block diagram of live temperature monitoring graphically using Arduino IDE
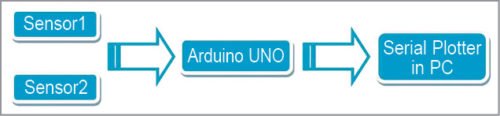
Circuit diagram of the project
Arduino Uno board
Arduino Uno is an AVR ATmega328P microcontroller-based development board with six analogue input pins and 14 digital input/output (I/O) pins. The microcontroller has 32kB of ISP flash memory, 2kB RAM and 1kB EEPROM. The board provides the capability of serial communication via UART, SPI and I2C. The microcontroller can operate at a clock frequency of 16MHz. In this project, analogue input pins A0 and A1 of the Arduino are used to interface the two temperature sensors.
LM35
ICs in this series are precision temperature sensors, whose output voltage is linearly proportional to the Celsius (Centigrade) temperature. Thus these have an advantage over linear temperature sensors calibrated in degree Kelvin, as the user is not required to subtract a large constant voltage from its output to obtain convenient Centigrade scaling.
LM35 IC does not require any external calibration or trimming to provide typical accuracies of ±1⁄4°C at room temperature and ±3⁄4°C over a full –55°C to +150°C temperature range. The scale factor (sensitivity) is 10mV/°C.
The LM35 sensors (Sens1 and Sens 2) produce output voltages proportional to the process temperature with a scale factor of 10mV/°C, which are fed to the Arduino’s analogue input pins A0 and A1, respectively. Calibration of the voltage to process temperature data is carried out by the Arduino running the program serial_plotter.ino. After calculation of the temperature, data is plotted on the Serial Plotter.
Software
Serial Plotter function is available in Arduino IDE 1.6.12 version. Select the proper COM port and board from Tools menu of the IDE. Upload program code (serial_plotter.ino) to the board. Go to Tools menu, open Serial Plotter and select the correct baud rate (9600 is used here) to display the graph.
Download source folder
Read More Detail:Multi-Sensor Data Plotting using Arduino IDE
- How is the temperature data displayed in this project?
The data is plotted graphically in real time on a computer monitor using the Serial Plotter function within the Arduino IDE. - What type of microcontroller is used in the Arduino Uno board?
The board uses an AVR ATmega328P microcontroller with 32kB of ISP flash memory. - Does the LM35 sensor require external calibration?
No, the LM35 IC does not require any external calibration or trimming to provide typical accuracies. - What is the scale factor for the LM35 sensors?
The scale factor is 10mV per degree Celsius. - Which pins on the Arduino are used for the temperature sensors?
Analogue input pins A0 and A1 are used to interface the two temperature sensors. - What baud rate is used to display the graph?
A baud rate of 9600 is used to display the graph in the Serial Plotter. - Can this system monitor more than one sensor at a time?
Yes, the project demonstrates monitoring live temperature data from two on-field temperature sensors simultaneously. - What programming file is uploaded to the board?
The program code serial_plotter.ino is uploaded to the board.
