
Summary of Arduino + Processing – Make a Radar Screen – Part 3: Visualising the Data from Sharp Infrared Range Finder
The article details integrating a Sharp Infrared range finder with an Arduino servo rig to improve radar display accuracy. Key adjustments include adding delays, casting sensor values to integers, and filtering readings outside the 20cm–150cm range. The system averages multiple readings per degree and magnifies data for better visualization on a Processing screen.
Parts used in the Radar Screen Visualisation:
- Sharp GP2Y0A02 IR range finder
- Arduino board
- Servo motor
- Processing software
- Analog pin (Pin 1)
So I had some luck with getting the Sharp Infrared range finder working and I’ve now plugged this on to my servo rig to see if I get better results on my radar styled display.
Check out how to use the Sharp IR range finder here
Few things to bare in mind, whilst the code is pretty much the same there are a few subtle differences. Firstly for better readings the Arduino code has a longer delay – but since we’re not allowing for a sonar ping there’s not much noticeable difference.
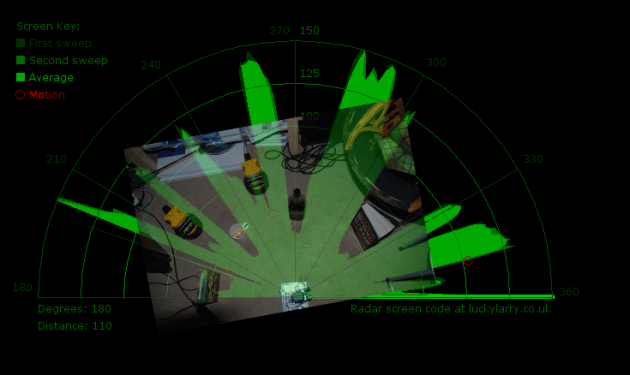
Next we’re expecting integer values in the processing code so when sending values to over the serial port we cast them from float to integer.
Because the IR sensor has a different range I’ve altered the display to measure only up to 150cm. And becasue of this range limitation, if there is any value recorded outside of this range then we need to handle it to avoid seeing spikes and the same for any value under 20cm we need to also handle this.
To make the display more readable I keep the same size screen and area (radius of 300) and then multiply the sensor values by 2 to magnify them a bit more.
Other than it, it’s basically the same code as before and when we look at the image comparison now between what the sensor records and what is physically there we see a far better match, in some cases it’s a little to accurate.
Arduino sketch
/*
luckylarry.co.uk
Radar Screen Visualisation for Sharp GP2Y0A02 IR range finder
Sends sensor readings for every degree moved by the servo
values sent to serial port to be picked up by Processing
*/
#include <Servo.h>            // include the standard servo library
Servo leftRightServo;         // set a variable to map the servo
int leftRightPos = 0;         // set a variable to store the servo position
const int numReadings = 10;   // set a variable for the number of readings to take
int index = 0;                // the index of the current reading
float total = 0;              // the total of all readings must be a float to allow totaling of float values
int average = 0;              // the average
int IRpin = 1;                // analog pin for reading the IR sensor

/* setup the pins, servo and serial port */
void setup() {
  leftRightServo.attach(9);
  // initialize the serial port:
  Serial.begin(9600);
}

/* begin rotating the servo and getting sensor values */
void loop() {
  for(leftRightPos = 0; leftRightPos < 180; leftRightPos++) {  // going left to right.
    leftRightServo.write(leftRightPos);
      for (index = 0; index<=numReadings;index++) {            // take x number of readings from the sensor and average them
        float volts = analogRead(IRpin)*0.0048828125;          // value from sensor * (5/1024) - if running 3.3.volts then change 5 to 3.3
        float distance = 65*pow(volts, -1.10);                 // worked out from graph 65 = theretical distance / (1/Volts)S - luckylarry.co.uk
        total = total + distance;                              // update total
        delay(20);
      }
    average = (int) total/numReadings;                         // create average reading CAST TO INT!! remove the decimal places

    if (index >= numReadings)  {                               // reset the counts when at the last item of the array
      index = 0;
      total = 0;
    }
    Serial.print("X");                                         // print leading X to mark the following value as degrees
    Serial.print(leftRightPos);                                // current servo position
    Serial.print("V");                                         // preceeding character to separate values
    Serial.println(average);                                   // average of sensor readings
  }
  /*
  start going right to left after we got to 180 degrees
  same code as above
  */
  for(leftRightPos = 180; leftRightPos > 0; leftRightPos--) {  // going right to left
    leftRightServo.write(leftRightPos);
    for (index = 0; index<=numReadings;index++) {
      float volts = analogRead(IRpin)*0.0048828125;            // value from sensor * (5/1024) - if running 3.3.volts then change 5 to 3.3
      float distance = 65*pow(volts, -1.10);                   // worked out from graph 65 = theretical distance / (1/Volts)S - luckylarry.co.uk
      total = total + distance;
      delay(20);
    }
For more detail: Arduino + Processing – Make a Radar Screen – Part 3: Visualising the Data from Sharp Infrared Range Finder
- How do I handle values outside the sensor range?
Values recorded outside the 20cm to 150cm range must be handled to avoid seeing spikes on the display. - Can I change the voltage calculation for 3.3 volt systems?
Yes, if running at 3.3 volts, you should change the value 5 to 3.3 in the analogRead multiplication formula. - What is the best way to smooth sensor readings?
The code takes ten readings per position and calculates the average before sending the integer value to the serial port. - Does the delay time affect the sonar ping?
No, since the IR sensor does not use a sonar ping, there is no noticeable difference caused by the longer delay. - How are float values sent over the serial port?
The processing code expects integers, so the Arduino casts the calculated distance from float to integer. - What radius size is used for the display area?
The display keeps the same size screen and area with a radius of 300 units. - Why are sensor values multiplied by 2?
Values are multiplied by 2 to magnify them slightly more for better readability on the fixed screen size. - What character marks the start of a degree value?
The code prints a leading X character to mark the following value as degrees.
