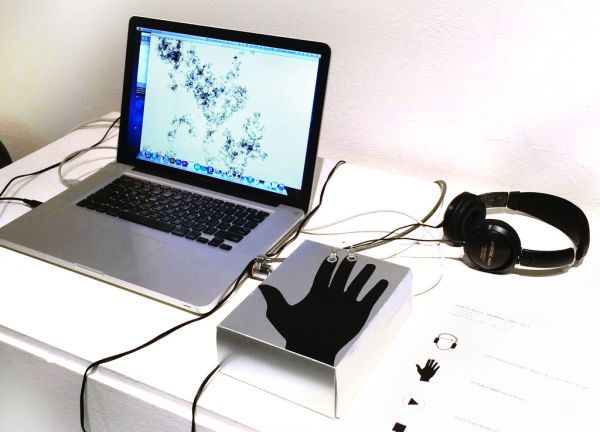
I’m a graphic design student and built this project for a beginning electronics class. I’m interested in connecting the signals generated by one’s body to the act of visual generation. This piece takes the galvanic skin response value of the user and uses it to fuel the creation of a visual on screen. Galvanic skin response is thought to be correlated to a person’s stress level and is used in lie detectors. In this particular work, the GSR value affects the speed at which a black growth is visualized on screen. This represents the idea that the more stressed we are, the faster diseases and other negative consequences can spread.
The hardware part of this project is fairly straightforward and uses an Arduino Uno board and the following other materials:
– Arduino Uno w/usb connector
–Breadboard
– 2 250K resistors, in a series
– Jumper wires
– Stranded wires
– 2 ring terminals (or other metal objects to place fingers on)
– Solder + soldering iron
The more complicated part of this project was coding in the Processing environment. These instructions will be in two main steps, “Hardware” and “Code” with a brief mention in step three of the construction of the enclosure for the electronics.
Step 1: Hardware
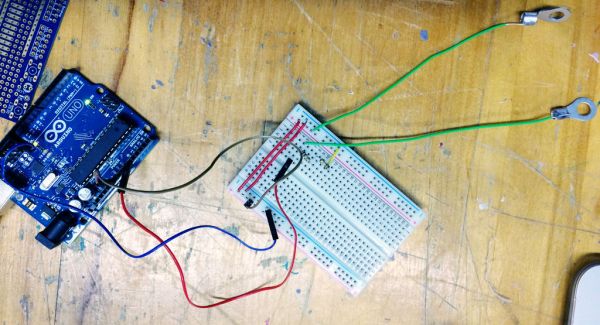
To make the sensors, I soldered the two ring terminals to jumper wires (you can also use stranded wires) and connected the wires to the breadboard as noted in the photograph and schematic. One wire is connected to 5V and the second wire is connected to GND through two 250K resistors in a series. This second sensor’s wire is also connected to the A0 terminal on the Arduino. These connections to the Arduino are all made via the breadboard.
Step 2: Code
For the coding part of this project, I referred to the two sources below. You don’t need to look at these sources unless you want to understand them in their original form. If you just want to copy/paste code that works, skip to 3) My Code.
1) GSR Source Code
The first was http://cwwang.com/2008/04/13/gsr-reader/ which includes the Arduino code (for Arduino and Processing to communicate) and the Processing code to use the galvanic skin response data from the constructed sensors. Wang’s code basically charts a person’s galvanic skin response value in a moving line graph, which looks a little like an EKG reading visually. I wanted to have a more abstract visualization of the data so used code from another source to generate the visuals.
2) Visual Source Code
The code to create the visuals is from: http://www.generative-gestaltung.de/P_2_2_1_01
For more detail: Stress Makes Art: Galvanic Skin Response and Visual Generation