
Summary of Drive a webpage in real-time using Arduino, SensorMonkey and Processing.js
This tutorial shows how to stream real-time Arduino sensor data to a webpage using the free SensorMonkey service and Processing.js, without needing server-side code or an Ethernet shield. It uses Bloom (or a Processing serial-to-network sketch on Mac/Linux) to forward Arduino serial data to SensorMonkey, which publishes it for remote visualization. The example samples analog pins (e.g., an ADXL335 accelerometer) and sends synchronized serial packets for live web visualization.
Parts used in the Remote visualization of real-time sensor data:
- Arduino (Uno or Duemilanove)
- USB cable to connect Arduino to host computer
- Analog sensor (example ADXL335 accelerometer)
- Assorted wires to connect sensor to Arduino
- Arduino development environment (software)
- Free SensorMonkey account (service)
- Bloom (serial port to TCP/IP socket redirector for Windows)
- Processing.js (for webpage visualization)
- Processing sketch SensorMonkeySerialNet (alternative serial-to-network proxy for Mac/Linux)
Remote visualization of real-time sensor data.
This tutorial describes in detail how to use the free SensorMonkey service to push real-time sensor data from an Arduino to a webpage for visualization using Processing.js. No server-side coding or Ethernet shield is required. A standard, run of the mill Arduino will work perfectly. You’ll also need a sensor to sample some values. I use an accelerometer, but anything will work (a potentiometer, a gyroscope, a tilt sensor, a temperature sensor, a light sensor etc.). If you don’t have a sensor, it’s still possible to follow the tutorial by sampling the floating input voltages on the Arduino’s analog pins as a (somewhat) crude substitute.
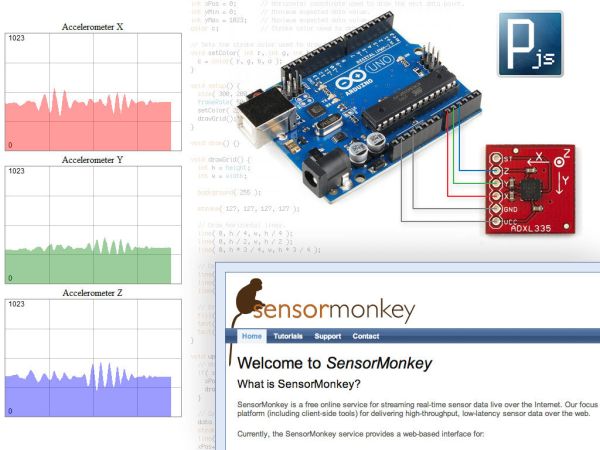
After configuring the Arduino to sample sensor values, I use SensorMonkey to publish the data live over the Internet in real-time (Disclosure: I co-founded the company developing SensorMonkey). Using SensorMonkey, I can access the data from any device connected to the Internet and use it to drive a real-time webpage. Proxies, firewalls and NATs can all be traversed. Best of all, it works with standard Arduino boards (Unos, Duemilanoves etc.) and does not require an Ethernet shield. Instead, I use free software called Bloom to network-enable the Arduino and connect it to SensorMonkey. In this tutorial, I visualize the data using Processing.js.
UPDATE 26-06-2012: Non-Windows Users
As an alternative to Bloom for non-Windows users, I have uploaded a Processing sketch, namedSensorMonkeySerialNet, to our GitHub account. This sketch is a serial-to-network proxy that also serves Flash Socket Policy files inline. It can be used instead of Bloom in Step 3 for users running Mac OS or Linux.
Step 1: Gathering Materials
The following combination of hardware and software is required to complete this tutorial:
Hardware:
– Arduino (I use an Uno but older boards such as a Duemilanove will work fine)
– USB cable to connect Arduino to host computer
– Analog sensor (I use a ADXL335 accelerometer)
– Assorted wires to connect your sensor to the Arduino
Software:
– Arduino development environment (http://www.arduino.cc)
– Free account on SensorMonkey.com (login with your existing Facebook account)
– Bloom (serial port to TCP/IP socket redirector for Microsoft Windows)
– Processing.js
Step 2: Connect Arduino and Upload Sketch
If you have not done so already, you should take the time to familiarize yourself with the basic operation of an Arduino by reading the Getting Started guide on the main Arduino website. In particular, make sure you have downloaded and installed the Arduino development environment and that you are able to upload sketches to the board. The Arduino will be assigned a serial port when connected to the host computer. If using Windows, you can determine the assigned serial port by opening Device Manager and expanding the Ports (COM & LPT) section. You should see the Arduino listed underneath (in my case, the Arduino has been assigned to COM8).
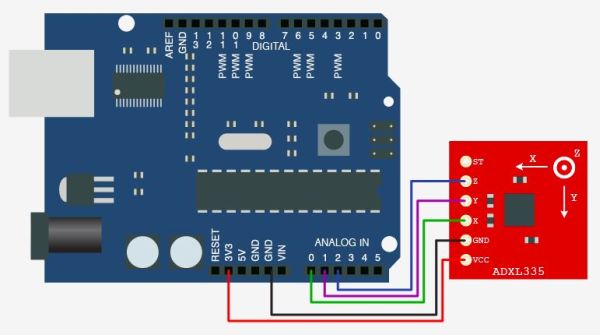
I have connected my ADXL335 accelerometer to the Arduino as shown (image taken from http://bildr.org). I am going to sample analog-to-digital (ADC) pins 0, 1 and 2 on the Arduino at regular intervals and write their values to the serial port. To do this, I upload the following sketch to the Arduino’s microcontroller using the development environment:
void setup() {
Serial.begin( 9600 ); // Open the serial port.
}
void loop() {
unsigned int x = analogRead( 0 ); // Read 10-bit x-axis accelerometer on ADC pin 0.
unsigned int y = analogRead( 1 ); // Read 10-bit y-axis accelerometer on ADC pin 1.
unsigned int z = analogRead( 2 ); // Read 10-bit z-axis accelerometer on ADC pin 2.
// Write synchronization bytes to serial port to act as starting markers for each ‘packet’.
Serial.write( 0xA5 );
Serial.write( 0x5A );
For more detail: Drive a webpage in real-time using Arduino, SensorMonkey and Processing.js
- Can I visualize Arduino sensor data remotely without an Ethernet shield?
Yes. The tutorial uses Bloom or a serial-to-network proxy to network-enable a standard Arduino and SensorMonkey to publish data without an Ethernet shield. - What software is needed to send Arduino serial data to SensorMonkey?
Bloom is used on Windows to redirect serial to TCP/IP; a Processing sketch named SensorMonkeySerialNet is provided as an alternative for Mac and Linux. - Does this method require server-side coding?
No. The tutorial explicitly states no server-side coding is required; SensorMonkey publishes the data and Processing.js visualizes it client-side. - Which Arduino pins are sampled in the example?
The example samples analog-to-digital (ADC) pins 0, 1 and 2. - What example sensor is used in the tutorial?
An ADXL335 accelerometer is used as the example analog sensor. - How are data packets synchronized when sent over serial?
The Arduino sketch writes synchronization bytes 0xA5 and 0x5A to the serial port as starting markers for each packet. - Can I follow the tutorial without a sensor?
Yes. The tutorial notes you can sample floating input voltages on analog pins as a crude substitute if no sensor is available. - What is used to visualize the live data on a webpage?
Processing.js is used to visualize the live sensor data on a webpage. - Will proxies, firewalls and NATs block this approach?
No. The tutorial states SensorMonkey can traverse proxies, firewalls and NATs to provide access to the data.
