
Summary of Domotic Greenhouse
This article describes an automated greenhouse monitoring system using Arduino MKR1000 and UNO to track temperature and humidity via a DHT22 sensor. The Master unit sends data to a web server, while the Slave unit controls actuators like heaters and fans based on thresholds. An Android app visualizes real-time data stored in a database.
Parts used in the Automated Greenhouse Monitoring System:
- Arduino MKR1000
- Arduino UNO & Genuino UNO
- DHT22 Temperature Sensor
- Arduino Wifi Shield 101
- Android device
- DC Motor Control Shield with BTN8982 for Arduino Infineon
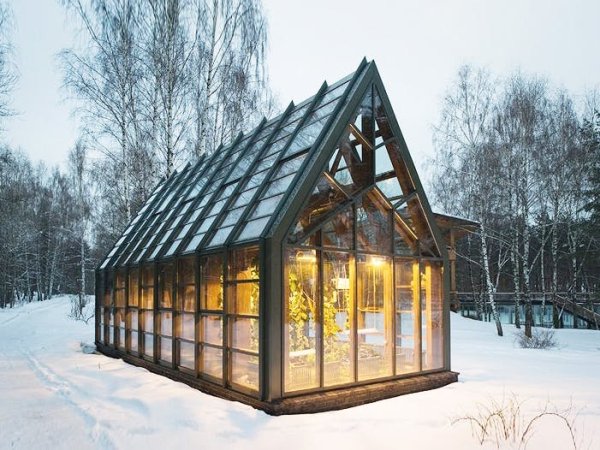
Electronic greenhouse controlled real-time, because the environmental conditions change continuously, so we need an efficient monitoring.
Things used in this project
Hardware components |
||||||
 |
|
× | 1 | |||
 |
|
× | 1 | |||
 |
|
× | 1 | |||
 |
|
× | 1 | |||
 |
|
× | 1 | |||
|
× | 1 | ||||
Software apps and online services |
||||||
 |
|
|||||
|
||||||
Story
Overview
The greenhouse environmental conditions change continuously, for this reason we need an efficient monitoring.
There are a lot of benefits of using an automatic system, for example less work or most important the users can check their own investments from their house by PC or smartphone.
Another important advantage is the possibility to store data into a DataBase. This can make the difference between gaining or losing money.
Furthermore, thanks to a real-time system control we can intervene immediately, preventing problems for cultivation.
The automatic monitoring system in greenhouses is composed of sensors that read environment data and actuators, called “Slaves”. They communicate via Wireless with central device, called “Master”. The latter sends possible changes to slaves (like change of thresholds) and data via WiFi to webserver as well.
1. How does it Work?
We can split this project in three different parts:
- Master
- Slave
- Web Server
We’ve used an Arduino/Genuino MKR1000 for the Master, an Arduino/Genuino Uno for the Slave.
The Master communicates with a Web Server via WiFi (WINC1500 integrated), the Slave acquires temperature and humidity with DHT22 sensor, and then it sends these data to the Master via WiFi (WiFi shield WINC1500).
2. Master
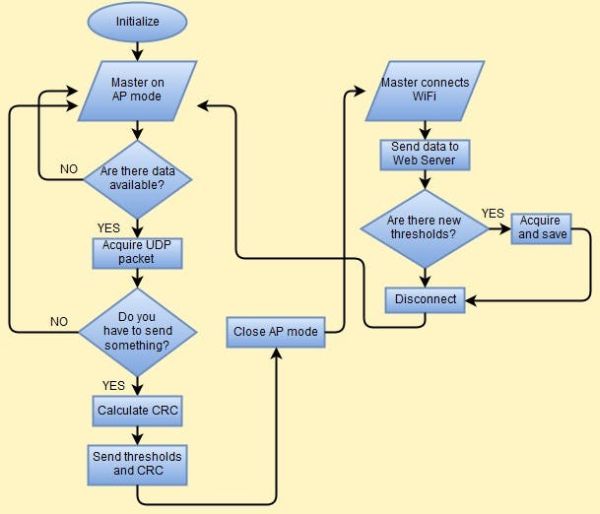
The Master is on “Access Point mode” and it waits for the Slave connection to receive the temperature and humidity that are elaborated and sent to the Web Server.
The Master checks if there are data available, in this case it creates an UDP packet formed by new thresholds and CRC. Infacts, it calculates the CRC that will be used by the Slave to validate the setting received.
After the Master gets out of “Access Point mode”, it connects to the WiFi, in order to send data to WebServer where they will be put in a graph.
3. Slave
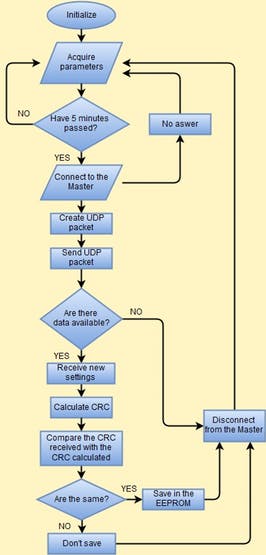
The Slave acquires temperature and humidity by DHT22 sensor and after 5 minutes it sends data to the Master. It also creates an UDP packet, it connects to the Master and then sends the data.
Later it waits if there are some data available, such as new thresholds. In this case, the Slave receives new settings and calculates the CRC using the Dallas-Maxim formulas.
Subsequently the CRC calculated is compared with the CRC received from the Master. If the two CRC are the same, the Slave saves the new setting in the EEPROM.
4. Web Server
The Web Server saves all the data that later can be stored in a history.
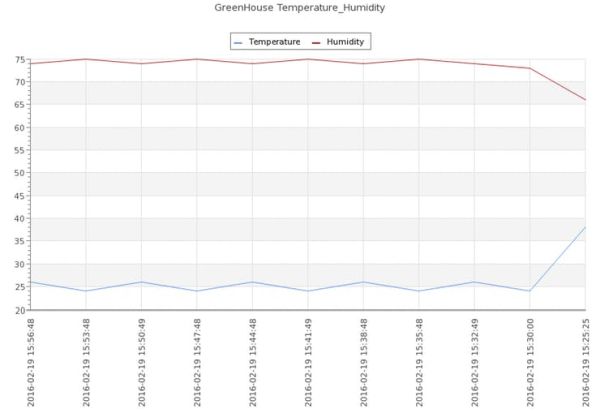
In order to do that, we have used a PHP script that connects to database and shows data in two different ways
- in a graph, using another PHP script
- in an Android app, in JSON format using another PHP script
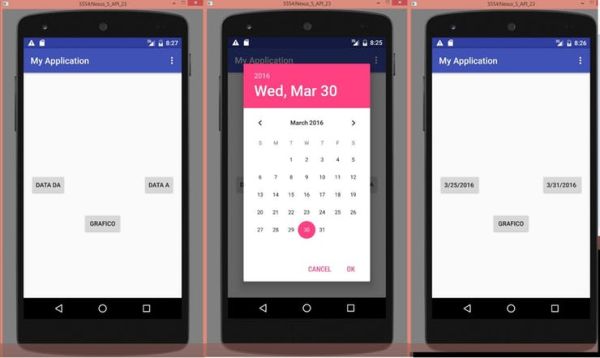
5. APP
The App allows us to consult the data into a Data Base.
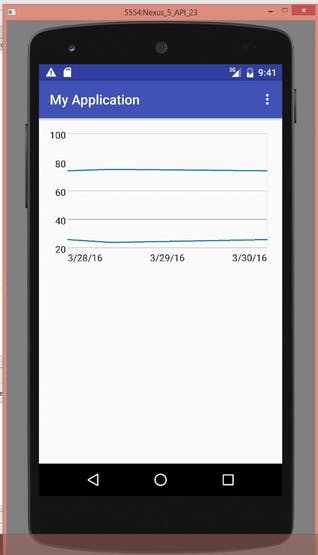
In the first screen, we can select the timing range to show and with the button “GRAPHIC”, it contacts the web service and gets the data.
The App shows data into graphic.
Schematics
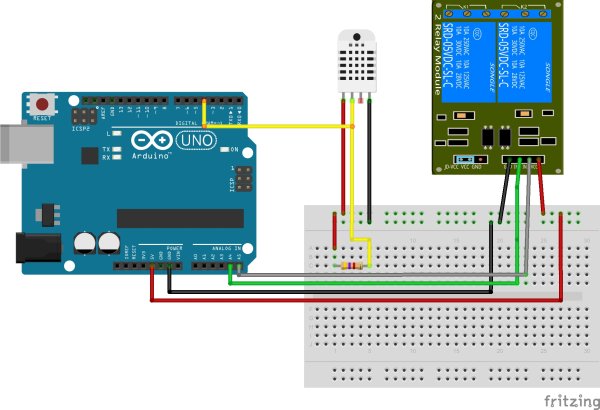
Arduino uno with DHT22
Code
Create graphic
PHP
<?php // content="text/plain; charset=utf-8"

define('__ROOT__', dirname(dirname(__FILE__)));
require_once ('../jpgraph.php');
require_once ('../jpgraph_line.php');
require_once ('../jpgraph_error.php');

$parameter1 = array();
$parameter2 = array();
$time_axis = array();
$i = 0;

$con=mysqli_connect("localhost","user","pass","my_db");
// Check connection
if (mysqli_connect_errno()) {
  echo "Failed to connect to MySQL: " . mysqli_connect_error();
}

$result = mysqli_query($con,"SELECT your_parameter FROM your_raw");

while($row = mysqli_fetch_array($result)) {
$parameter1[$i] =  $row["parameter1"];
$parameter2[$i] = $row["parameter2"];
$time_axis[$i] = $row["date"];
    $i++;
}

mysqli_close($con);

// Setup the graph
$graph = new Graph(300,250);
$graph->SetScale("textlin");

$theme_class=new UniversalTheme;

$graph->SetTheme($theme_class);
$graph->img->SetAntiAliasing(false);
$graph->title->Set('Title');
$graph->SetBox(false);

$graph->img->SetAntiAliasing();

$graph->yaxis->HideZeroLabel();
$graph->yaxis->HideLine(false);
$graph->yaxis->HideTicks(false,false);

$graph->xgrid->Show();
$graph->xgrid->SetLineStyle("solid");
$graph->xaxis->SetTickLabels($time_axis);
$graph->xgrid->SetColor('#E3E3E3');
$graph->xaxis->SetLabelAngle(90);
$graph->legend->SetPos(0.5,0.08,'center','top');

// Create the first line
$p1 = new LinePlot($parameter1);
$graph->Add($p1);
$p1->SetColor("#6495ED");
$p1->SetLegend('your_parameter1');
$graph->yscale->SetGrace(0);

// Create the second line
$p2 = new LinePlot($parameter2);
$graph->Add($p2);
$p2->SetColor("#B22222");
$p2->SetLegend('your_parameter2');

$graph->yscale->SetGrace(0);

$graph->legend->SetFrameWeight(1);

// Output line
$graph->Stroke();

?>
<?php
$servername = "localhost";
$username = "user";
$password = "pass";
$dbname = "my_db";

$id = $_GET["name"];
$temp = $_GET["parameter1"];
$umid = $_GET["parameter2"];


echo "name ". $_GET['name']. "<br />";
echo "parameter1 ". $_GET['parameter1']. "<br />";
echo "parameter2 ". $_GET['parameter2']. "<br />";


// Create connection
$conn = mysqli_connect($servername, $username, $password, $dbname);
// Check connection
if (!$conn) {
    die("Connection failed: " . mysqli_connect_error());
}

$sql = "INSERT INTO greenhouse (name, parameter1, parameter2)
VALUES ('".$name."', '".$parameter1."', '".$parameter2."')";

if (mysqli_query($conn, $sql)) {
    echo "New record created successfully";
} else {
    echo "Error: " . $sql . "<br>" . mysqli_error($conn);
}

mysqli_close($conn);
?>
Create table
SQL
CREATE TABLE IF NOT EXISTS `greenhouse` (
  `id` int(11) NOT NULL,
  `date` timestamp NOT NULL DEFAULT CURRENT_TIMESTAMP ON UPDATE CURRENT_TIMESTAMP,
  `temp` float NOT NULL,
  `umid` float NOT NULL
) ENGINE=MyISAM DEFAULT CHARSET=utf8;
Source : Domotic Greenhouse
- How does the system communicate between devices?
The Master communicates with the Web Server via WiFi, while the Slave sends data to the Master via WiFi. - Can users check their investments from home?
Yes, users can check their investments from their house by PC or smartphone. - What happens if the CRC calculated by the Slave matches the received CRC?
If the two CRCs are the same, the Slave saves the new setting in the EEPROM. - Does the system store data in a database?
Yes, the system stores data into a Database to help gain or lose money effectively. - How often does the Slave send data to the Master?
The Slave acquires data and sends it to the Master after 5 minutes. - What is the role of the Web Server in this project?
The Web Server saves all data that can later be stored in history and displayed in graphs. - How does the Android app display information?
The App shows data into a graphic after contacting the web service to get JSON formatted data. - What is the purpose of the QR code mentioned in the text?
A QR code will be put on sold products so users can read plantation steps and environment conditions. - What libraries are used in the Master code?
The Master code uses SPI.h, WiFi101.h, RTCZero.h, and WiFiUDP.h.
