
Summary of Project curve tracer – progress update
This article details the project's initial hardware release and the strategic split of firmware and GUI into separate repositories to streamline development. The hardware version 1.0 supports oscilloscope visualization, XY mode, and specific voltage/current limits via USB. Firmware updates include new PWM outputs for XY mode, while the GUI now allows saving plots as CSVs and controlling live data display.
Parts used in the Project Curve Tracer:
- KiCAD files
- Gerber files
- BOM files
- C files (Firmware)
- Python GUI
- Microcontroller
- Probe outputs
- USB connection
As the hardware is at the point of initial release, but the firmware and GUI aren’t quite there yet, I decided that it would be prudent to split off the firmware and GUI components into their own GIT repositories. Tracking all files in the same repository was convenient through the initial stages of project development, but splitting them allows for more targeted releases and will likely make contributions easier. For instance, if someone wished to write a Java client, then they could simply fork the GUI repository and not worry about the hardware and firmware repositories.
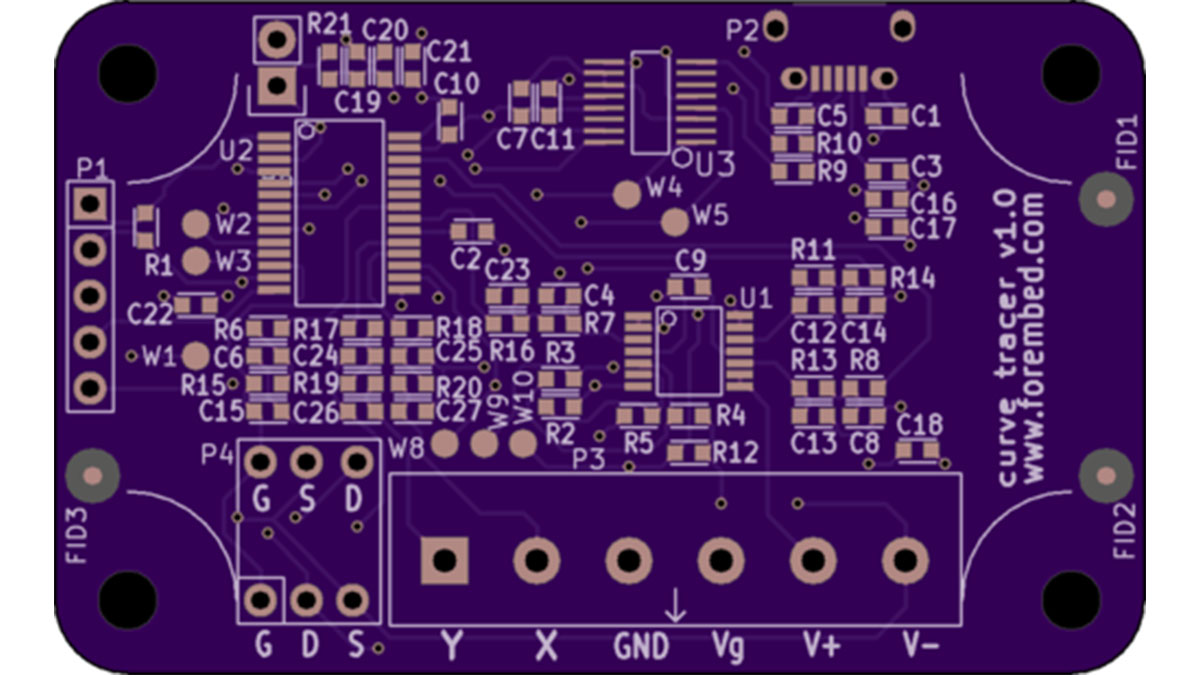
As it stands, there are three repositories:
- hardware – dedicated to the KiCAD, gerber and BOM files
- firmware – dedicated to the C files that comprise the firmware of the microcontroller
- GUI – dedicated to the GUI (currently Python)
Hardware Progress
We have released v1.0 of the hardware! This release supports:
- Your choice of visualization, Oscilloscope or Desktop
- Use of XY mode available on most oscilloscopes
- Maximum of +/-5.0V on the probe outputs
- Gate voltage application of up to 5.0V
- Transistor base current of up to 10mA
- Uses USB for the power supply (connects as Virtual COM Port)
Once the firmware and GUI catch up wit the hardware in maturity, we will create a curve tracer page in the references to get you up and running quickly!
Firmware Progress
Minor improvements and functionality have been added to the firmware. Specifically, two XY outputs were added to support the oscilloscope XY mode. These are simply PWM outputs that reflect the measured component voltage and current. There have been some small bug-fixes and improvements, but the firmware has been working well for some time now and is nearing that ‘v1.0’ milestone.
Client GUI Progress
The Client has shown the most progress in recent weeks. We can save a live plot as a CSV file, recall that plot, and erase it. We can also ‘run’ and ‘pause’ the live plot as needed.
Read more: Project curve tracer – progress update
- Why were the components split into separate repositories?
Splitting allows for more targeted releases and makes contributions easier by isolating specific areas like Java clients. - What does the hardware repository contain?
The hardware repository is dedicated to KiCAD, gerber, and BOM files. - What is the maximum gate voltage application supported?
The hardware supports a gate voltage application of up to 5.0V. - How are the two XY outputs generated in the firmware?
They are simply PWM outputs that reflect the measured component voltage and current. - Can the live plot be saved in the GUI?
Yes, the client can save a live plot as a CSV file. - Does the device require an external power supply?
No, it uses USB for the power supply and connects as a Virtual COM Port. - What programming language is currently used for the GUI?
The GUI is currently written in Python. - What is the maximum transistor base current available?
The system supports a transistor base current of up to 10mA.
